


This retrospective study examined changes in medication orders as a risk factor for future acute hypoglycemic events. The investigators identified factors associated with acute hypoglycemic events resulting in emergency department visits or inpatient admissions. Non-Hispanic Black race, chronic kidney disease, insulin at baseline, and nonprivate insurance were associated with higher risk of an acute hypoglycemic event, whereas age, sex, and A1C were not. After adjustment for other risk factors, changes in insulin orders after A1C measurement were associated with a 1.5 times higher risk of an acute hypoglycemia (adjusted hazard ratio 1.48, 95% CI 1.08–2.03). These results further understanding of risk factors and clinical processes relevant to predicting and preventing acute hypoglycemia.
Diabetes affects an estimated 30.3 million people in the United States (9.4% of the population) (1). Hypoglycemia is the most common acute complication of diabetes treatment, accounting for ∼300,000 emergency department visits and inpatient hospitalizations annually in the United States (2,3). This complication imposes a massive financial burden on the U.S. health care system and represents a significant source of morbidity for patients, as acute hypoglycemic events are associated with a range of negative health outcomes, including decreased quality of life and increased risks of dementia, stroke, cardiovascular events, and death (4–9).
Advances in and widespread use of electronic medical record (EMR) systems have resulted in a wealth of retrospective patient data, as well as novel opportunities to prospectively assess risk and deliver decision support. Prior research has identified several risk factors for acute hypoglycemic events, many of which can be identified via EMR data and leveraged to inform personalized clinical decision-making (10–12). However, it is unknown how these risk factors may be influenced by clinical care decisions such as medication changes that are made after risk factors are assessed. Understanding these complex processes could provide insight into crucial points for intervention and timely decision support. Accordingly, in this study, we aimed to evaluate the association between traditional risk factors and acute hypoglycemic events and examine the timing of medication changes based on A1C measurements as a potential point of intervention.
Research Design and Methods
Data Source, Cohort Identification, and Observation Periods
We used patient clinical data from the University of California, San Francisco (UCSF) Medical Center collected from 1 June 2012 to 31 May 2017 to assemble a cohort of adult patients with pharmacologically treated type 2 diabetes at UCSF Health. First, we identified a cohort of patients with type 2 diabetes using a standardized algorithm that incorporates laboratory values, medication orders, and diagnosis codes from patients’ EMR (13). The date of diabetes recognition in our cohort was defined as the first date a patient met the following criteria: one or more diabetes-related inpatient diagnosis codes or two or more diabetes-related outpatient diagnosis codes on separate days; two or more elevated laboratory values on separate days no more than 2 years apart (A1C ≥6.5%, fasting glucose ≥126 mg/dL, or random glucose ≥200 mg/dL); or one or more orders for glucose-lowering medications. Patients with orders for metformin, thiazolidinediones, or exenatide with no other indication of diabetes were not included, as these agents can be used for reasons other than diabetes control.
For each patient who met the diabetes case definition, the first potential 12-month observation period was the earliest date on or after the date of diabetes recognition that an A1C value was recorded; we further required there to be at least one order for a glucose-lowering medication in the 365 days before the A1C measurement to identify patients with pharmacologically treated diabetes. Patients could contribute multiple observation periods. For each observation period, the date of A1C measurement was considered the index date; the 365 days before the index date was the baseline observation period during which covariate information was assessed, and the 365 days after the index date was the follow-up period during which acute hypoglycemic events were observed.
For a given observation period, patients were followed until the first of any of the following: end of the 365-day window, death, new A1C measurement, or acute hypoglycemic event. Each time a new A1C measurement was recorded, a new observation period began. For a given observation period, we only counted the first acute hypoglycemic event; however, individuals could contribute additional observational periods (including additional hypoglycemic events) after an initial acute hypoglycemic event.
Study Exposures and Covariates
For each observation period, all exposures and covariates were assessed using data from the 365 days preceding the index date (i.e., baseline for that observation period). Age, sex, and race/ethnicity were extracted from patients’ EMR. Age was calculated using the patient’s date of birth and the current index date. Self-identified race and ethnicity were used to classify patients into the following categories: non-Hispanic Black, non-Hispanic White, non-Hispanic Asian, Hispanic, and other/unknown. A1C values were extracted and categorized into the following five groups to allow for nonlinearity in the association between A1C and acute hypoglycemia: <6, 6–6.9, 7–7.9, 8–8.9, and ≥9%. Chronic kidney disease (CKD) stage 4–5 status was determined based on the most proximal estimated glomerular filtration rate (eGFR) laboratory value preceding the index date; eGFR is determined using the CKD-EPI (Chronic Kidney Disease Epidemiology Collaboration Equation) (14). Patients with eGFR values ≤29 mL/min/1.73 m2 were categorized as having CKD (stage 4–5) (15).
Use of glucose-lowering therapy was classified based on all medication orders recorded in patients’ EMR during the baseline period and was categorized as follows: any insulin use, secretagogue use but no insulin use, metformin use only, or use of other glucose-lowering medications. All medication orders during the follow-up period (up to 365 days after A1C measurement) were extracted to determine time-varying changes in medication orders after A1C measurement. Changes in medication orders were classified into the following categories: change in insulin orders, change in secretagogue orders but no change in insulin orders, change in metformin only, change in other glucose-lowering medication, or no changes in medication orders. Change in medication orders was defined using the medication generic name as well as the “sig” field (directions for use); a change to either field resulted in the medication order being classified as a change.
Insurance coverage was ascertained based on the most proximal encounter preceding each index date and was categorized as private insurance, Medicare, Medicaid, or other/unknown.
Outcome
Acute hypoglycemic events were identified via diagnosis codes from an emergency department or inpatient encounter (with diagnosis present on admission for inpatient encounters) using a validated International Classification of Diseases, 9th revision, (ICD-9)–based coding algorithm that we adapted to include 10th revision (ICD-10) codes (Supplementary Table S1) (16).
Statistical Analysis
First, we examined the distribution of baseline characteristics in the overall sample using data from the first observation period contributed by each patient (Table 1). Next, using data from all available observation periods, we examined incidence rates of acute hypoglycemic events overall and by putative risk factor category.
Baseline Characteristics From the First Observation Period Contributed by Each Participant
| N = 6,998 | |
|---|---|
| Age, years, mean (SD) | 60.9 ± 15.2 |
| Age category, years | |
| <60 | 3,083 (44.1) |
| 60 to <70 | 1,996 (28.5) |
| 70 to <80 | 1,248 (17.8) |
| ≥80 | 671 (9.6) |
| Female sex | 3,419 (48.9) |
| Race/ethnicity* | |
| Non-Hispanic White | 2,308 (33.0) |
| Non-Hispanic Asian | 1,888 (27.0) |
| Non-Hispanic Black | 898 (12.8) |
| Hispanic | 1,020 (14.6) |
| Other/unknown | 884 (12.6) |
| A1C category, % | |
| <6 | 872 (12.5) |
| 6–6.9 | 2,215 (31.7) |
| 7–7.9 | 1,778 (25.4) |
| 8–8.9 | 986 (14.1) |
| ≥9 | 1,147 (16.4) |
| CKD (stage 4–5)† | 319 (4.6) |
| Medication order during baseline period | |
| Any insulin | 2,662 (38.0) |
| Any secretagogues, no insulin | 1,656 (23.7) |
| Metformin only | 2,175 (31.1) |
| Other glucose-lowering medication | 505 (7.22) |
| Insurance‡ | |
| Private | 2,419 (34.6) |
| Medicare | 3,174 (45.4) |
| Medicaid | 1,184 (16.9) |
| None/other/unknown | 221 (3.2) |
| Number of observation periods per patient | 3.7 ± 3.4 |
| Change in medication order after A1C measurement§ | |
| Change in insulin medication orders | 3,115 (13.7) |
| Change in secretagogue medication orders, no change to insulin | 2,300 (10.1) |
| Change in metformin only | 1,542 (6.8) |
| Other glucose-lowering medication change | 755 (3.3) |
| No change in medication orders | 14,961 (66.0) |
| Number of medication changes during observation period | 2.4 ± 2.0 |
| Days to medication change, median (IQR)‖ | 13 (2–60) |
Data are mean ± SD or n (%) unless otherwise noted.
Race/ethnicity was based on patient self-reports.
CKD (stage 4–5) was determined using eGFR laboratory values; patients with stage 4–5 CKD had eGFR values ≤29 mL/min/1.73 m2.
Insurance status was determined using the insurance class recorded for the last available encounter preceding the index date.
Across all observations (n = 22,673).
Across all observations with a medication change after A1C measurement (n = 7,712). IQR, interquartile range.
To allow for recurring acute hypoglycemic events and changes in covariates over time, we used an extended Cox model with a robust variance estimator to account for repeated measures (17,18). In this model, multiple observation periods per individual are created such that each observation period reflects follow-up of up to 365 days, with censoring criteria as described above.
We examined unadjusted associations between traditional risk factors and acute hypoglycemic events in univariate models and examined associations in a multivariate model simultaneously adjusting for all traditional risk factors. We then examined the risk associated with medication changes, modeled as a time-varying covariate, in univariate and multivariate models adjusting for traditional risk factors. As a sensitivity analysis, we excluded all acute hypoglycemic events identified via ICD-9 code 250.80, which is not specific to hypoglycemia, but rather is based on a rule-out diagnosis that requires the absence of a host of co-diagnoses (16).
Finally, to evaluate how well identified risk factors discriminated risk for acute hypoglycemic events in our sample, we calculated Harrell’s C-statistic (19). All analyses were conducted using SAS, v. 9.4, software. This study was approved by the UCSF institutional review board.
Results
A total of 52,037 UCSF patients were identified as meeting the diabetes case definition between 1 June 2012 and 31 May 2017. We excluded 36,365 patients with no A1C measurements on or after the date of diabetes recognition, 8,344 patients with no orders for glucose-lowering medications, and 330 patients with missing data on key risk factors, resulting in a final analytic sample of 6,998 patients with pharmacologically treated type 2 diabetes. At the beginning of the first observation period, patients were mostly over the age of 60 years (66%), about half female (49%), and racially diverse (Table 1). Approximately half of the sample had baseline A1C measurements ranging from 6.0 to 7.9%, and 5% of the sample had CKD (stage 4–5 based on eGFR values). Patients were treated with insulin (38%), secretagogues without insulin (24%), metformin only (31%), or other oral glucose-lowering medications only (7%). Medication changes during follow-up were recorded in 8,314 observation periods (37% of the 22,673 total). Across all observations with a medication change post-A1C, 38% involved a change to insulin treatment, 27% involved changes to secretagogues (but no changes to insulin), 25% were changes to metformin only, and 10% were changes to other glucose-lowering medications; the median number of days to the first medication change was 11 (interquartile range 2–56).
Overall, 249 acute hypoglycemic events occurred over a total of 22,673 observation periods (cumulative incidence 1.1%). Each patient contributed an average of 3.7 observation periods (mean length 178 days). Across the 22,673 total observation periods, patients accrued 11,032 person-years of observation, resulting in an overall incidence rate of 22.6 hypoglycemic events per 1,000 person-years (Table 2).
Incidence Rates of Acute Hypoglycemia Among Pharmacologically Treated Patients With Type 2 Diabetes
| Observations, n. | Events, n.. | Cumulative Incidence, %. | Person-Years at Risk | Incidence per 1,000 Person-Years. | |
|---|---|---|---|---|---|
| Overall | 22,673 | 249 | 1.1 | 11,032.1 | 22.6 |
| Age category, years | |||||
| <60 | 8,452 | 95 | 1.1 | 4,389.1 | 21.6 |
| 60 to <70 | 6,595 | 69 | 1.0 | 3,195.8 | 21.6 |
| 70 to <80 | 4,992 | 49 | 1.0 | 2,241.6 | 21.9 |
| ≥80 | 2,634 | 36 | 1.4 | 1,205.7 | 29.9 |
| Race/ethnicity | |||||
| Non-Hispanic White | 6,759 | 62 | 0.9 | 3,371.3 | 18.4 |
| Non-Hispanic Asian | 7,276 | 58 | 0.8 | 3,297.6 | 17.6 |
| Non-Hispanic Black | 2,961 | 69 | 2.3 | 1,484.2 | 46.5 |
| Hispanic | 2,966 | 37 | 1.2 | 1,516.4 | 24.4 |
| Other/unknown | 2,711 | 23 | 0.8 | 1,362.6 | 16.9 |
| A1C category, % | |||||
| <6 | 2,033 | 32 | 1.6 | 1,102.4 | 29.0 |
| 6–6.9 | 6,292 | 52 | 0.8 | 3,259.4 | 16.0 |
| 7–7.9 | 6,516 | 53 | 0.8 | 3,057.6 | 17.3 |
| 8–8.9 | 3,807 | 56 | 1.5 | 1,709.2 | 32.8 |
| ≥9 | 4,025 | 56 | 1.4 | 1,903.4 | 29.4 |
| CKD (Stage 4–5) | |||||
| No | 21,423 | 196 | 0.9 | 10,487.3 | 18.7 |
| Yes | 1,250 | 53 | 4.2 | 544.7 | 97.3 |
| Medication orders during baseline | |||||
| Any insulin | 9,176 | 173 | 1.9 | 4,316.6 | 40.1 |
| Any secretagogues, no insulin | 6,174 | 53 | 0.9 | 2,919.3 | 18.2 |
| Metformin only | 5,589 | 13 | 0.2 | 2,947.7 | 4.4 |
| Other glucose-lowering medication | 1,734 | 10 | 0.6 | 848.5 | 11.8 |
| Insurance | |||||
| Private | 6,545 | 36 | 0.6 | 3,466.5 | 10.4 |
| Medicare | 12,086 | 160 | 1.3 | 5,502.1 | 29.1 |
| Medicaid | 3,579 | 45 | 1.3 | 1,806.6 | 24.9 |
| None/other/unknown | 463 | 8 | 1.7 | 256.8 | 31.2 |
| Change in medication after A1C* | |||||
| Change in insulin medication orders | 3,170 | 65 | 2.1 | 1,325.6 | 49.0 |
| Change in secretagogue medication orders; no change to insulin | 2,039 | 14 | 0.7 | 897.8 | 15.6 |
| Change in metformin only | 1,726 | 2 | 0.1 | 638.4 | 3.1 |
| Other glucose-lowering medication change | 863 | 4 | 0.5 | 284.1 | 14.1 |
| No change in medication orders | 22,673 | 164 | 0.7 | 7,886.1 | 20.8 |
For each observation period, patients were followed for up to 365 days after A1C measurement until the first of the following occurred: acute hypoglycemic event, death, new A1C measurement, or the end of the 365-day period. Acute hypoglycemic events were identified via ICD-9 and ICD-10 diagnosis codes from encounters that occurred in the emergency department or in the hospital (and were present on admission).
The number of observation periods used to calculate incidence rates across categories of time-varying medication changes does not equal 22,673 because each change in medication post-A1C triggered a new row of data, which created the possibility of multiple rows of data for each observation period.
We observed considerable variation in incidence rates of acute hypoglycemic events across risk factors. Rates of acute hypoglycemic events were 2.5 times higher in non-Hispanic Blacks than in non-Hispanic Whites and were nearly five times higher in those with CKD (stage 4–5) than in those with earlier-stage CKD (stage 1–3) or without CKD. Incidence rates across A1C categories followed a U-shaped trend, with higher rates occurring in those with low and high A1C (Figure 1). More than 90% of acute hypoglycemic events occurred among individuals with prior treatment with insulin or secretagogues at baseline, and rates of acute hypoglycemic events were highest among those with insulin treatment before baseline. Across categories of time-varying medication changes, rates of acute hypoglycemic events were highest among those with changes to insulin treatment.
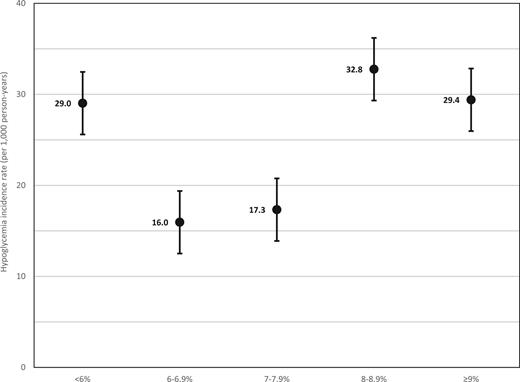
Hypoglycemia incidence rates and 95% CIs across A1C categories. For each observation period, patients were followed for up to 365 days after A1C measurement until the first of the following occurred: acute hypoglycemic event, death, new A1C measurement, or the end of the 365-day period. Acute hypoglycemic events were identified via ICD-9 and ICD-10 diagnosis codes from encounters that occurred in the emergency department or in the hospital (and were present on admission).
Hypoglycemia incidence rates and 95% CIs across A1C categories. For each observation period, patients were followed for up to 365 days after A1C measurement until the first of the following occurred: acute hypoglycemic event, death, new A1C measurement, or the end of the 365-day period. Acute hypoglycemic events were identified via ICD-9 and ICD-10 diagnosis codes from encounters that occurred in the emergency department or in the hospital (and were present on admission).
In univariate Cox models (Table 3, model 1), non-Hispanic Black race, low and high levels of A1C, CKD (stage 4–5), medication orders for insulin, and nonprivate insurance were all associated with increased risk of acute hypoglycemic events; medication orders for metformin were associated with a decreased risk of acute hypoglycemic events. In multivariate Cox models (Table 3, model 2), all associations were attenuated but remained statistically significant except for A1C category, which was no longer statistically significant. The Harrell’s C-statistic for the multivariate model including traditional risk factors was 0.775.
Association Between Traditional Risk Factors and Acute Hypoglycemic Events
| Model 1: Univariate Model | Model 2: Multivariate Model* | |||
|---|---|---|---|---|
| HR (95% CI) | P | HR (95% CI) | P | |
| Age category, years | 0.48 | 0.58 | ||
| <60 | REF | REF | ||
| 60 to <70 | 0.98 (0.68–1.43) | 0.97 (0.68–1.39) | ||
| 70 to <80 | 0.98 (0.65–1.48) | 0.90 (0.59–1.37) | ||
| ≥80 | 1.34 (0.87–2.06) | 1.24 (0.77–2.02) | ||
| Female sex | 1.05 (0.78–1.41) | 0.76 | 0.99 (0.73–1.32) | 0.92 |
| Race/ethnicity | <0.0001 | 0.003 | ||
| Non-Hispanic White | REF | REF | ||
| Non-Hispanic Asian | 0.93 (0.62–1.39) | 0.96 (0.65–1.41) | ||
| Non-Hispanic Black | 2.52 (1.70–3.74) | 2.10 (1.36–3.22) | ||
| Hispanic | 1.34 (0.79–2.25) | 1.24 (0.75–2.04) | ||
| Other/unknown | 0.92 (0.54–1.56) | 0.98 (0.57–1.67) | ||
| A1C category, % | <0.0001 | 0.10 | ||
| <6 | 1.86 (1.19–2.90) | 1.56 (0.99, 2.46) | ||
| 6–6.9 | REF | REF | ||
| 7–7.9 | 1.06 (0.72–1.57) | 0.95 (0.65–1.41) | ||
| 8–8.9 | 2.01 (1.31–3.07) | 1.50 (0.97–2.32) | ||
| ≥9 | 1.83 (1.20–2.78) | 1.28 (0.82–1.99) | ||
| CKD (Stage 4–5) | <0.0001 | <0.0001 | ||
| No | REF | REF | ||
| Yes | 5.17 (3.62–7.39) | 2.96 (2.01–4.35) | ||
| Medication orders, pre-A1C | <0.0001 | <0.0001 | ||
| Any insulin | 3.41 (1.69–6.86) | 2.76 (1.37–5.56) | ||
| Any secretagogues, no insulin | 1.53 (0.76–3.07) | 1.41 (0.70–2.84) | ||
| Metformin only | 0.38 (0.16–0.90) | 0.39 (0.16–0.93) | ||
| Other glucose-lowering medication | REF | REF | ||
| Insurance | <0.0001 | 0.001 | ||
| Private | REF | REF | ||
| Medicare | 2.73 (1.81–4.12) | 2.38 (1.56–3.61) | ||
| Medicaid | 2.39 (1.43–4.00) | 1.93 (1.15–3.24) | ||
| Other/Unknown | 3.05 (1.40–6.68) | 2.84 (1.31–6.15) | ||
REF, reference.
In univariate models examining the association between time-varying changes in medication orders post-A1C measurement (Table 4), changes to insulin orders (hazard ratio [HR] 2.35, 95% CI 1.76–3.15) were associated with a significantly increased risk of acute hypoglycemic events, whereas changes to metformin orders were associated with a decreased risk of acute hypoglycemic events (HR 0.31, 95% CI 0.04–0.60). In models adjusting for all traditional risk factors identified above, changes to insulin orders remained associated with a significantly higher risk of an acute hypoglycemic event (adjusted HR 1.48, 95% CI 1.08–2.03) and changes to metformin orders remained associated with a significantly lower risk of an acute hypoglycemic event (adjusted HR 0.22, 95% CI 0.05–0.90). Harrell’s C-statistic for the multivariate model adjusted for time-varying medication changes was 0.779. In sensitivity analyses, excluding acute hypoglycemic events identified with ICD-9 code 250.80 (n = 53 events, 21% of total acute hypoglycemic events) did not materially alter our findings (Supplementary Table S2).
Association Between Time-Varying Changes in Medication Orders After A1C Measurement and Acute Hypoglycemic Events
| Model 1: Univariate Model | Model 2: Multivariate Model* | |||
|---|---|---|---|---|
| HR (95% CI) | P | HR (95% CI) | P | |
| Change in medication after A1C measurement | <0.0001 | 0.01 | ||
| Change in insulin medication orders | 2.35 (1.76–3.15) | 1.48 (1.08–2.03) | ||
| Change in secretagogue medication orders; no change to insulin | 0.73 (0.42–1.26) | 0.78 (0.45–1.34) | ||
| Change in metformin only | 0.15 (0.04–0.60) | 0.22 (0.05–0.90) | ||
| Other glucose-lowering medication change | 0.65 (0.24–1.75) | 0.66 (0.25–1.76) | ||
| No change in medication orders | REF | REF | ||
REF, reference.
Discussion
In this sample of pharmacologically treated patients with type 2 diabetes from UCSF, we observed significant variation in incidence rates of acute hypoglycemic events across patient subgroups defined by traditional risk factors (ranging from 4.4 to 97.3 events/1,000 person-years). We also identified independent time-varying risk associated with changes in insulin orders; this risk factor is controlled by clinicians and thus represents a potential point for intervention in the clinical workflow to reduce the incidence of acute hypoglycemic events.
The associations we observed with traditional risk factors are generally consistent with previous studies. We observed a significantly increased risk of acute hypoglycemic events among non-Hispanic Black patients, those treated with insulin, and those with CKD (stage 4–5) (3,20–26). Although non-Hispanic Blacks accounted for only 13% of the study population, they experienced 38% of the total acute hypoglycemic events. The crude incidence rate of acute hypoglycemic events was 2.5 times higher in non-Hispanic Blacks than in non-Hispanic Whites, and this difference persisted in fully adjusted Cox models. The reasons for this disparity are unknown but warrant further investigation.
There have been conflicting findings as to the pattern of A1C preceding acute hypoglycemic events. In patients with type 1 diabetes, the Diabetes Control and Complications Trial showed an inverse relationship between A1C and acute hypoglycemia. In type 2 diabetes, data from randomized controlled trials showed that intensive glucose control (which resulted in lower A1C) was associated with increased risk of an acute hypoglycemic event (27–30). However, more recent evidence in type 2 diabetes, including a post hoc analysis of the ACCORD (Action to Control Cardiovascular Risk in Diabetes) trial, have reported that patients with higher A1C values have a greater risk of an acute hypoglycemic event (26). Data from our study generally indicate a U-shaped association, with an increased risk at lower and higher A1C levels (Table 2 and Figure 1), although associations were nonsignificant in multivariate models; this pattern was also observed in a recent observational study (31).
Contrary to previous studies, we did not observe an association between acute hypoglycemic events and age (28,29). We examined age as a continuous (data not shown) as well as a categorical variable. There was a suggestion that the risk of acute hypoglycemic events was slightly higher among older patients in our sample (≥80 vs. <60 years of age, adjusted HR 1.24, 95% CI 0.77–2.02); however, this difference was not statistically significant.
Expanding on findings from previous studies, our results revealed significantly increased risk of acute hypoglycemic events among patients with nonprivate insurance. Compared with those with private insurance (35% of the sample at baseline), patients with Medicare, Medicaid, and other/unknown insurance coverage had two to three times higher risk of an acute hypoglycemic event in multivariate models. It is unclear whether this association is mediated by disparities in access to care (although all insurance types are accepted at UCSF), variation in medication coverage and glucose monitoring technology, or residual confounding by other clinical, cultural, or socioeconomic factors associated with insurance type. Prior studies have reported an increased risk of acute hypoglycemic events associated with low socioeconomic status and with Medicaid insurance (25,32). To our knowledge, however, our study is the first to observe increased risk of acute hypoglycemic events among patients with Medicare insurance.
Our study has several limitations. First, the outcomes identified are acute hypoglycemic events that were diagnosed in the emergency department or hospital at UCSF. We restricted ascertainment of our outcome to these most severe and costly hypoglycemic episodes in keeping with prior studies of severe hypoglycemia in diabetes (10,11). That said, we acknowledge that, with this method of outcome ascertainment, we are capturing only a fraction of total hypoglycemic events and do not address the role of less severe but more frequent hypoglycemic episodes. We do not know what led patients experiencing an acute hypoglycemic event to seek medical attention in the emergency department or hospital; it is possible that care-seeking behaviors may differ across key risk factors (33). Additionally, because UCSF is a nonintegrated health care system, patients with diabetes who receive usual care at UCSF may not present to UCSF for treatment in the event of severe hypoglycemia; this situation would result in under-ascertainment of the true number of acute hypoglycemic events, which would likely bias our results toward the null. Second, medication orders and changes in medication orders were broadly classified into insulin, secretagogues, metformin, and other glucose-lowering medications; we were unable to quantify dosage/frequency for each medication and thus were unable to determine whether changes represented intensification or deintensification of medications. Third, this study relied entirely on retrospective clinical data extracted from patients’ EMR. Because clinical data are collected for reasons other than research, nonoptimal measurements derived from these data increase the risk of residual confounding and selection bias.
Our analysis also has unique strengths. We captured acute hypoglycemic events occurring up to mid-2018, providing more recent estimates of acute hypoglycemic events than have been reported in other studies and expanding event ascertainment to include ICD-10 diagnosis codes. We also identified nonprivate insurance as an important predictor of acute hypoglycemic events. Further, we used the rich clinical data available through the EMR system to identify a potential intervention point to deliver hypoglycemia-related decision support. Providing support at the point of medication renewal/changes after A1C measurement could potentially help to improve clinical decision-making and reduce acute hypoglycemic events.
These results further our understanding of the real-world risk factors and clinical processes relevant to predicting and preventing acute hypoglycemic events. In this study of pharmacologically treated patients with type 2 diabetes, >90% of acute hypoglycemic events occurred among individuals with orders for insulin or secretagogues at baseline. We further used EMR data to identify key decision points that could be singled out for future intervention and delivery of decision support. Along with confirming previously identified risk factors in a different setting, we identified medication change orders as a time-varying risk factor and potential intervention opportunity for preventing future hypoglycemic events.
Article Information
Funding
This work was supported by the National Institutes of Health (T32 AG049663 to M.E.L., KL2 TR001996 to M.E.L., R01 AG047500 to R.A.W., R01AG047897 to S.J.L., and R01AG057751 to S.J.L.) and the Patient-Centered Outcomes Research Institute (PPRN-1306-04709 to M.E.L. and M.J.P.).
Duality of Interest
No potential conflicts of interest related to this article were reported.
Author Contributions
M.E.L. conceived of the study, conducted analyses, and drafted the manuscript. R.A.W., S.J.L., R.J.R., and M.J.P. assisted with study design/data interpretation and reviewed/edited the manuscript. M.E.L. is the guarantor of this work and, as such, had full access to all the data in the study and takes responsibility for the integrity of the data and the accuracy of the data analysis.
This article contains supplementary material online at https://doi.org/10.2337/figshare.13682836.