


Quantify the impact of genetic and socioeconomic factors on risk of type 2 diabetes (T2D) and obesity.
Among participants in the Mass General Brigham Biobank (MGBB) and UK Biobank (UKB), we used logistic regression models to calculate cross-sectional odds of T2D and obesity using 1) polygenic risk scores for T2D and BMI and 2) area-level socioeconomic risk (educational attainment) measures. The primary analysis included 26,737 participants of European genetic ancestry in MGBB with replication in UKB (N = 223,843), as well as in participants of non-European ancestry (MGBB N = 3,468; UKB N = 7,459).
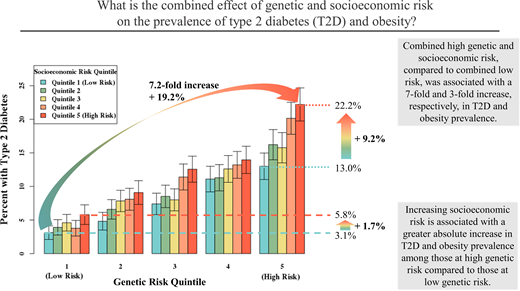
The area-level socioeconomic measure most strongly associated with both T2D and obesity was percent without a college degree, and associations with disease prevalence were independent of genetic risk (P < 0.001 for each). Moving from lowest to highest quintiles of combined genetic and socioeconomic burden more than tripled T2D (3.1% to 22.2%) and obesity (20.9% to 69.0%) prevalence. Favorable socioeconomic risk was associated with lower disease prevalence, even in those with highest genetic risk (T2D 13.0% vs. 22.2%, obesity 53.6% vs. 69.0% in lowest vs. highest socioeconomic risk quintiles). Additive effects of genetic and socioeconomic factors accounted for 13.2% and 16.7% of T2D and obesity prevalence, respectively, explained by these models. Findings were replicated in independent European and non-European ancestral populations.
Genetic and socioeconomic factors significantly interact to increase risk of T2D and obesity. Favorable area-level socioeconomic status was associated with an almost 50% lower T2D prevalence in those with high genetic risk.
Introduction
Genetic and socioeconomic factors have both been shown to increase the risk of metabolic diseases, including type 2 diabetes (T2D) and obesity (1–4). However, the relative contributions of these two factors—one intrinsic and unmodifiable and one extrinsic and potentially modifiable—and the degree to which they may interact to impact an individual’s risk are poorly understood, especially in populations historically underrepresented in research.
Several studies have examined gene-environment interactions in the UK Biobank (UKB); however, in many cases, these studies test a broad list of environmental factors, ranging from diet to smoking to socioeconomic status, without an in-depth examination of specific factors (5–7). Because of this, a rigorous understanding of the association between socioeconomic factors and disease is often lacking. Additionally, the extent to which understanding gene-socioeconomic interactions is useful for identifying individuals or communities at increased disease susceptibility, or whether this information could guide more efficient public health policies to reduce the burden of metabolic diseases at a population level, is unknown.
Here, we hypothesize that genetic and socioeconomic factors interact in their association with T2D and obesity prevalence. We present a detailed and quantitative examination of the independent and additive effects of genetic and socioeconomic risk in two unrelated biobanks, using comprehensive “global extended polygenic scores” (gePS) and area-level measures of socioeconomic status tested within these data sets. First, we examine the association of multiple area-level socioeconomic risk measures with the prevalence of T2D and obesity. We then quantify the effects of genetic and socioeconomic risk on the prevalence of these metabolic diseases, including the degree to which living in high-deprivation areas interacts with individual genetic risk. To understand the relationship of these risk factors across populations, we first focus on individuals of European genetic ancestry in the Mass General Brigham Biobank (MGBB), a hospital-based biobank in Boston, MA, with replication in a European ancestry subset of the UKB, a population-based biobank in the U.K. Lastly, we extend these analyses to participants of other ancestries in both biobanks.
Research Design and Methods
Data Source and Participants
The MGBB is a health care system–based biobank in New England (8) including demographic and clinical information from electronic health records for approximately 115,000 individuals. We included all enrolled individuals whose genotyping had been completed by March 2020 (N = 33,745; Supplementary Table 1 and Supplementary Fig. 1) and excluded related individuals, those without a full address listed (as required for geocoding to a census tract), and those with fewer than five clinical encounters (as likely to have incomplete phenotypic data). We restricted to individuals who fell into one of the three largest genetic ancestry groups (European, African, and [admixed] American subsets) based on the Pan-UKB method of assigning genetic ancestry, based on mapping to reference genome data sets and excluding outliers that do not map closely with a single genetic ancestry (9). Population admixture occurs when two or more previously isolated ancestral populations converge, resulting in new populations with genetic ancestry reflecting multiple origins (10); individuals in the (admixed) American subset include those with indigenous American genetic ancestry; the majority of these individuals self-identified as either Hispanic or other race/ethnicity.
A replication analysis was performed using the UKB, a population-based biobank including approximately 500,000 individuals in the U.K. (11,12). We included all enrolled individuals with complete genetic and area-level socioeconomic information, excluding related individuals (12), those living outside of England (as the socioeconomic measures used in different countries within the U.K. were distinct), those with missing phenotype designation, and those not of European, African, or Central or South Asian ancestry according to the Pan-UKB method (9).
We analyzed each genetic ancestry group separately in stratified analyses, with European ancestry acting as the primary analysis in both data sets, and analyses in other ancestry groups considered exploratory.
Socioeconomic Risk Factors
As socioeconomic risk is composed of many related elements and is variably defined in the literature, we assessed multiple area-level socioeconomic risk variables in each data set to determine which factors most strongly associated with disease prevalence. Area-level socioeconomic measures were used in the primary analysis in order to maximize sample size and avoid selection bias; sensitivity analyses using individual-level, self-reported socioeconomic measures were performed on subsamples in which these data were available.
In MGBB, we geocoded each individual’s address to their respective census tract, using the DeGAUSS (Decentralized Geomarker Assessment for Multi-Site Studies) geocoder (13), assigning census tract–level measures of educational attainment (percent with less than a college degree and percent with less than a high school degree living in the tract), income/poverty (inverse of median household income and percent living below 100%, 150%, or 200% of the federal poverty limit in the tract), and employment (percent aged 18–65 years who are unemployed in the tract), and deprivation indices (Social Deprivation Index [14], Social Vulnerability Index [15]) based on data from the American Community Survey 2014–2018.
In UKB, each individual was assigned lower layer super output area–level measures of socioeconomic deprivation, including deprivation indices (Index of Multiple Deprivation [16], Townsend Deprivation Index [17]), and subscores of the Index of Multiple Deprivation capturing educational deprivation, income deprivation, and employment deprivation (field IDs: 26410.0.0, 189.0.0, 26414.0.0, 26411.0.0, 26412.0.0), by the UKB team.
For each population subset, we created age, sex, and self-reported race/ethnicity-adjusted logistic regression models predicting T2D and obesity prevalence for each socioeconomic variable; the variable with the greatest association size (odds ratio [OR]) was chosen as the main socioeconomic variable for subsequent analyses.
Genetic Risk Factors
In both MGBB and UKB, we defined genetic risk using gePS (1) for T2D, based on a genome-wide association study performed in the FinnGen and DIAGRAM (Diabetes Genetics Replication and Meta-analysis) cohorts (18,19), and for BMI, based on published summary statistics (20). gePS were calculated based on the weighted contributions of hundreds of thousands of genetic loci, rather than being restricted only to loci that meet strict genome-wide significance thresholds as in restricted-to-significant polygenic scores. These gePS may better capture overall genetic risk by allowing contributions from variants with real but small effects that may not achieve strict significance thresholds because of limited sample sizes in available genetic data sets; for most conditions, gePS have better predictive value than restricted-to-significant polygenic scores (1). We generated the gePS weights using PRS-CS (21), using the UKB European Linkage Disequilibrium reference panel and the summary statistics of the meta-analysis, which was performed with METAL (22) using a fixed-effects model with an inverse-variance weighting of log ORs.
Outcomes
The primary outcomes of this analysis were cross-sectional/prevalent T2D and obesity.
In MGBB, we defined T2D using two algorithms relying on clinical data in the electronic health record: a machine learning algorithm developed and validated within the biobank with a 90% positive predictive value (8) and an application of the eMERGE (electronic medical records and genomics) algorithm (23); using these algorithms, all individuals in MGBB were assigned a phenotype (presence or absence of T2D). We defined obesity by the presence of likely obesity based on a machine learning algorithm validated within the biobank with a 90% positive predictive value (8) or based on a maximum BMI of ≥30 kg/m2.
In UKB, we defined T2D based on a validated algorithm for the identification of T2D in the UKB (24); using this algorithm, approximately one-third of participants were not assigned a phenotype (low confidence of either the presence or absence of T2D) and were excluded from the analysis. We defined obesity by enrollment BMI of ≥30 kg/m2.
Statistical Analysis
We performed the primary analysis among individuals of European genetic ancestry because of relatively small sample sizes of non-European populations and the relatively poor performance of polygenic scores generated in populations of European genetic ancestry when applied to other populations (25). We repeated all analyses in exploratory subsets of African or American ancestry in MGBB and of African or Central/South Asian Ancestry in UKB.
We used multivariable logistic regression models to examine the association and interaction of genetic and socioeconomic risk with T2D and obesity prevalence, adjusting for age, sex, self-reported race/ethnicity, and the first 10 principal components of genetic variation. We presented ORs and 95% CI per SD change in genetic or socioeconomic risk measures and examined for multiplicative interactions between risk factors. Demographic characteristics, including age, sex, and race/ethnicity, were recorded based on self-report by the participant. Although all analyses were stratified by genetic ancestry, we adjusted analyses for self-reported race/ethnicity to account for the unique lived experience of the limited number of individuals who identified as a different race/ethnicity than predicted by their genetic ancestry. Race/ethnicity categories in MGBB included non-Hispanic White, non-Hispanic Black, Hispanic, non-Hispanic Asian, other, or missing; race/ethnicity categories in UKB included White, African, Caribbean, East Asian, South Asian, other, multiethnic (including self-reported “mixed” White and Black, White and Asian, and White and other categories), or missing/prefer not to answer (UKB field ID 21000). Genetic principal components capture the distribution of common genetic variation across a population (e.g., related to local ethnic background or artifacts of genotyping such as batch effects), and adjustment for principal components is recommended to control for these sources of variability (26). We generated genetic principal components using flashpca (27).
We evaluated additive interactions by calculating the relative excess risk due to interaction (28) and the attributable proportions due to genetics, socioeconomics, and the additive interactions of both risk factors (29,30). We performed mediation analysis using structural equation models (31) to examine the degree to which the association between socioeconomic risk and T2D was mediated through BMI (as socioeconomic risk is associated with higher BMI, which is associated with higher T2D prevalence).
We performed several sensitivity analyses, including 1) examining multivariable models using individual-level, rather than area-level, socioeconomic measures among a limited sample who self-reported educational attainment; 2) using an ethnicity-specific cutoff of enrollment BMI of ≥27.5 kg/m2 (32) to define obesity among individuals of Central/South Asian ancestry in the UKB; and 3) examining continuous BMI rather than binary obesity prevalence as an outcome.
Results
Primary Analysis: MGBB-European Ancestry Subset
Baseline Characteristics
Of the 33,745 individuals enrolled in the MGBB for whom genotype data were available, 26,737 were of European ancestry with complete socioeconomic information (the MGBB-European ancestry subset) (Supplementary Table 1 and Supplementary Fig. 1). Mean age was 61.4 years, 14,123 (52.8%) were women, and 2,731 (10.2%) and 12,272 (45.9%) had T2D and obesity, respectively (Table 1).
Population characteristics
| MGBB: European ancestry (n = 27,164) | MGBB: African ancestry (n = 1,614) | MGBB: American ancestry (n = 1,854) | UKB: European ancestry (n = 216,384) | UKB: African ancestry (n = 3,204) | UKB: Central or South Asian ancestry (n = 4,255) | ||
|---|---|---|---|---|---|---|---|
| Age, mean (SD) | 61.4 (16.6) | 54.2 (16.7) | 48.4 (16.1) | Age, mean (SD) | 56.5 (8.1) | 52.1 (8.2) | 53.9 (8.6) |
| Female, n (%) | 14,123 (52.8) | 1,002 (62.1) | 1,265 (68.2) | Female, n (%) | 114,750 (53.0) | 1,829 (57.1) | 1,894 (44.5) |
| Race/ethnicity, n (%) | Race/ethnicity, n (%) | ||||||
| Non-Hispanic White | 26,108 (97.6) | 3 (0.2) | 303 (16.3) | White | 214,967 (99.3) | 10 (0.3) | 112 (2.6) |
| Non-Hispanic Black | 0 (0) | 1,488 (92.2) | 2 (0.1) | Black | 3 (<0.1) | 1,182 (36.9) | 9 (0.2) |
| Hispanic | 1 (0) | 0 (0) | 816 (44.0) | Caribbean | 0 (0) | 1,287 (40.2) | 29 (0.7) |
| Asian | 0 (0) | 1 (0.1) | 4 (0.2) | East Asian | 54 (<0.1) | 0 (0) | 522 (12.3) |
| Native American | 22 (0.1) | 4 (0.2) | 14 (0.8) | South Asian | 4 (<0.1) | 0 (0) | 2,854 (67.1) |
| Other | 80 (0.3) | 67 (4.2) | 632 (34.1) | Other | 461 (0.2) | 290 (9.1) | 336 (7.9) |
| Missing | 526 (2.0) | 51 (3.2) | 83 (4.5) | Mixed White-Black | 21 (<0.1) | 315 (9.8) | 12 (0.3) |
| Mixed White-Asian | 83 (<0.1) | 0 (0) | 216 (5.1) | ||||
| Mixed White-other | 175 (0.1) | 52 (1.6) | 82 (1.9) | ||||
| Missing | 616 (0.3) | 68 (2.1) | 83 (1.9) | ||||
| T2D, n (%) | 2,731 (10.2) | 418 (25.9) | 335 (18.1) | T2D, n (%) | 16,558 (7.7) | 965 (30.1) | 1,712 (40.2) |
| Obesity, n (%) | 12,272 (45.9) | 1,053 (65.3) | 1,128 (60.8) | Obesity, n (%) | 46,355 (21.4) | 1,198 (37.4) | 952 (22.4) |
| Obesity (BMI ≥27.5%), n (%) | 1,761 (41.4) |
Associations of Genetic and Socioeconomic Risk With T2D and Obesity
Of the nine census tract–level socioeconomic risk variables examined, the percent of individuals in the census tract without a college degree had the strongest association with T2D and obesity and was used as the primary census tract–level socioeconomic measure subsequently (Fig. 1A and Supplementary Fig. 2A).

ORs of age, sex, and self-reported race/ethnicity-adjusted association between census tract–level socioeconomic measures in MGBB enrollees of European ancestry (A) and area-level socioeconomic measures in UKB enrollees of European ancestry (B). All ORs are reported per 1-SD change of the variable. Educ, education; Eng, England; Employ, employment; FPL, federal poverty level; IMD, index of multiple deprivation; Inc, income; SDI, social deprivation index; SVI, social vulnerability index; TDI, Townsend deprivation index.
ORs of age, sex, and self-reported race/ethnicity-adjusted association between census tract–level socioeconomic measures in MGBB enrollees of European ancestry (A) and area-level socioeconomic measures in UKB enrollees of European ancestry (B). All ORs are reported per 1-SD change of the variable. Educ, education; Eng, England; Employ, employment; FPL, federal poverty level; IMD, index of multiple deprivation; Inc, income; SDI, social deprivation index; SVI, social vulnerability index; TDI, Townsend deprivation index.
In multivariable models, genetic and socioeconomic risk contributed independently to the odds of both T2D (gePS OR 1.86, 95% CI 1.78–1.95; socioeconomic risk OR 1.29, 95% CI 1.23–1.35) and obesity (gePS OR 1.77, 95% CI 1.72–1.82; socioeconomic risk OR 1.29, 95% CI 1.25–1.32) (Table 2 and Supplementary Table 2).
Multivariable models examining the association of genetic and area-level socioeconomic risk with T2D or obesity among MGBB and UKB enrollees of European ancestry
| Subset: MGBB-European | Genetic risk (respective gePS [T2D, BMI], per SD) | Socioeconomic risk (% < college, per SD) | Genetic * socioeconomic risk |
|---|---|---|---|
| Outcome: T2D | 1.863 (1.779, 1.952), P = 7.0 × 10−152 | 1.285 (1.227, 1.346), P = 4.0 × 10⁻²⁶ | 1.007 (0.964, 1.051), P = 0.77 |
| Outcome: Obesity | 1.766 (1.718, 1.815), P = 2.0 × 10⁻¹⁶ | 1.285 (1.252, 1.32), P = 8.5 × 10−79 | 0.996 (0.969, 1.024), P = 0.76 |
| Subset: UKB-European | Genetic risk (respective gePS [T2D, BMI], per SD) | Socioeconomic risk (education score, per SD) | Genetic * socioeconomic risk |
| Outcome: T2D | 2.318 (2.276, 2.361), P < 1 × 10−300 | 1.394 (1.372, 1.416), P < 1 × 10−300 | 0.981 (0.967, 0.996), P = 0.01 |
| Outcome: Obesity | 2.789 (2.752, 2.826), P < 1 × 10−300 | 1.267 (1.253, 1.282), P < 1 × 10−300 | 0.975 (0.963, 0.986), P = 2.6 × 10⁻⁵ |
Models were adjusted for age, sex, self-reported race/ethnicity, and first 10 principal components of genetic variation, including both genetic and socioeconomic risk and a multiplicative interaction between genetic and socioeconomic risk in the model.
People in the highest quintile of both genetic and socioeconomic risk had a more than eightfold increased prevalence of T2D (prevalence 3.1% [95% CI 2.8–3.5%] vs. 22.2% [95% CI 21.4–23.0%]) and a more than threefold increased prevalence of obesity (prevalence 20.9% [95% CI 20.1–21.7%] vs. 69.0% [95% CI 68.1–69.9%]) compared with those in the lowest risk quintiles (Supplementary Tables 3 and 4). Increasing socioeconomic risk was associated with higher disease prevalence within each stratum of genetic risk; for example, for individuals within the highest quintile of genetic risk, T2D prevalence was ∼60% higher (22.2% [95% CI 21.4–23.0%] vs. 13.0% [95% CI 12.3–13.7%]) and obesity prevalence was ˜29% higher (69.0% [95% CI 68.1–69.9%] vs. 53.6% [95% CI 52.6–54.6%]) in the highest vs. lowest socioeconomic risk quintiles (Supplementary Tables 3 and 4 and Fig. 2A).

T2D and obesity prevalence by quintiles of genetic and socioeconomic risk in MGBB enrollees of European ancestry (A and B) and UKB enrollees of European ancestry (C and D).
T2D and obesity prevalence by quintiles of genetic and socioeconomic risk in MGBB enrollees of European ancestry (A and B) and UKB enrollees of European ancestry (C and D).
We observed a significant positive interaction between genetic and socioeconomic risk on the additive scale. For example, moving from the lowest to highest quintile of socioeconomic risk was associated with an absolute increase in T2D prevalence of 1.7% among those in the lowest quintile of genetic risk but 9.2% in the highest quintile of genetic risk. In adjusted models, the proportions of excess T2D and obesity prevalence attributable to this interaction were 13.2% (95% CI 7.2–19.2%; P = 5.8 × 10⁻⁴) and 16.7% (95% CI 12.3–20.9%; P = 4.5 × 10⁻¹¹), respectively (Supplementary Table 5). There was no evidence of multiplicative interactions between genetic and socioeconomic risk (P interaction = 0.77 for T2D, 0.76 for obesity).
Findings were consistent in sensitivity analyses using self-reported (rather than census tract–level) educational attainment in a subset of participants who completed a biobank survey (n = 13,576, 50%) (Supplementary Table 6).
Lastly, in mediation analyses, BMI mediated 47.6% of the association between socioeconomic risk and T2D (Supplementary Table 7).
Replication Analysis: UKB-European Genetic Ancestry Subset
The UKB-European ancestry subset included 216,384 individuals (Supplementary Table 1 and Supplementary Fig. 1). Compared with the MGBB-European subset, the UKB-European subset were younger and less likely to have either diabetes or obesity (Table 1). Similar to the MGBB analysis, an education-related metric of socioeconomic risk, the Education Deprivation Score, had the strongest association with T2D and obesity of the five area-level socioeconomic variables examined and was used as the primary socioeconomic risk measure (Fig. 1B and Supplementary Fig. 2B).
We again observed independent effects of the genetic and socioeconomic risk as well as marked stratification of T2D and obesity prevalence when combining these factors, with approximately 20-fold differences in disease prevalence between the lowest and highest combined genetic and socioeconomic risk quintiles (Fig. 2 and Supplementary Tables 8 and 9).
We also again observed significant positive interactions on the additive scale. In adjusted models, the proportions of excess T2D and obesity prevalence attributable to this interaction were 21.2% (95% CI 19.7–22.7%; P < 1.0 × 10⁻⁸) and 15.9% (95% CI 14.7–17.2%; P < 1.0 × 10⁻⁸), respectively (Supplementary Table 10). Additionally, we observed weak negative multiplicative interactions between genetic and socioeconomic risk (T2D: OR 0.98, 95% CI 0.97–1.00, P = 0.014; obesity: OR 0.98, 95% CI 0.96–0.98, P = 2.6 × 10⁻⁵) (Table 2 and Supplementary Tables 5, 8, and 9). These results indicate that increasing socioeconomic risk among those at high genetic risk compared with those with low genetic risk is associated with a greater absolute change in disease prevalence (positive additive interaction) but diminished relative change in disease prevalence (negative multiplicative interaction).
Findings were consistent in sensitivity analyses using self-reported (rather than area-level) educational attainment in a subset of participants who completed a biobank survey (n = 181,253, 84%), although multiplicative interactions were no longer significant (Supplementary Table 11).
We again found that BMI mediated approximately 40% of the association between socioeconomic risk and T2D (Supplementary Table 12).
Replication Analyses: Non-European Genetic Ancestry Populations
Compared with the European ancestry MGBB population, the MGBB participants of African (n = 1,614) and American (n = 1,854) ancestry were younger and more likely to be women, had higher rates of T2D and obesity, and lived in areas of higher socioeconomic deprivation (Supplementary Table 13 and Supplementary Fig. 3).
As in the MGBB-European subset, disease prevalence increased with increasing genetic and socioeconomic risk for T2D and obesity among the MGBB-American subset but only with increasing genetic risk among the MGBB-African subset (Supplementary Fig. 4). In multivariable analyses, genetic and census tract–level socioeconomic risk contributed independently to metabolic disease risk among those of American ancestry, whereas only genetic risk was independently associated with metabolic disease among those of African ancestry (Supplementary Table 14). There was no evidence of either multiplicative or additive interactions between genetic and socioeconomic risk for either disease in either subset (Supplementary Tables 14 and 15).
In the UKB, participants of African ancestry (n = 3,204) and Central/South Asian ancestry (n = 4,255) had higher rates of T2D and obesity compared with people of European ancestry and lived in areas of higher socioeconomic deprivation (Supplementary Table 16 and Supplementary Fig. 5).
As in the UKB-European subset, among the UKB-African and UKB-Central/South Asian subsets, disease prevalence increased with increasing genetic and socioeconomic risk for both T2D and obesity (Supplementary Fig. 6). Similarly, in multivariable analyses, genetic and socioeconomic risk contributed independently to the odds of metabolic disease (Supplementary Table 17). We again observed a significant, positive additive interaction between genetic and socioeconomic risk in relation to T2D in the UKB-Central/South Asian subset (Supplementary Table 18), but no significant multiplicative interactions between genetic and socioeconomic risk were observed for either subset. In analyses examining an ancestry-specific BMI cutoff (27.5 kg/m2) for the definition of obesity in the UKB-Central/South Asian subset (Supplementary Table 16 and Supplementary Fig. 6), both genetic and socioeconomic risk continued to be associated with metabolic disease prevalence (Supplementary Table 17).
Conclusions
In this study investigating the interplay between genetic and socioeconomic risk factors in relation to T2D and obesity, we have quantified genetic and socioeconomic risk associated with these conditions as well as the combined effect of these risk factors at a population level. We found that the prevalence of T2D and obesity more than tripled, from 3.1 to 22.2% and from 20.9 to 69.0%, respectively, among individuals from the lowest to the highest quintiles of combined genetic and socioeconomic risk. When holding genetic risk constant, favorable socioeconomic risk was associated with up to 50% lower disease prevalence, even among those with the highest genetic risk. We also demonstrated additive interactions suggesting greater absolute increases in disease prevalence with increasing socioeconomic risk among those who also have high genetic risk. These findings were replicated in multiple independent populations, including individuals of different genetic ancestry, suggesting that these associations may be generalizable to other developed nations, with implications for both precision medicine and public health.
Our primary analysis found that a 1-SD change in genetic or socioeconomic risk is associated with approximately 80% and 30% increased odds, respectively, of both T2D and obesity. The strong contribution of polygenic risk seen in our results supports a growing role for incorporating genetic information into predictive algorithms to identify high-risk individuals (1,36). Further, an individual’s environment and social determinants of health should be considered when assessing their risk, in addition to their clinical presentation. The use of area-level measures of socioeconomic risk, which is a potentially modifiable factor, albeit requiring extensive policy interventions and impacting health slowly over generations in most contexts (37), may allow for the identification of high-risk communities that may benefit from targeted interventions to improve disease identification and management (38).
Socioeconomic risk impacted the odds of disease across the spectrum of genetic risk, suggesting that efforts to improve socioeconomic deprivation may benefit all recipients, and public policy interventions should not be neglected in any genetic risk group. However, our results also demonstrated positive interactions on the additive scale in both European ancestry subsets. Among those with the highest genetic risk, favorable socioeconomic risk was associated with 9.2–12.6% and 15.5–19.2% absolute reductions in T2D and obesity prevalence, respectively. This suggests that the absolute change in disease prevalence, and thus the public health impact, of socioeconomic deprivation may be more marked in those at greater genetic risk.
Prior studies have examined the relationship between genetic and socioeconomic risk of metabolic disease, looking at risk for increased BMI and T2D, including within the UKB (5–7,39,40). Our study moves this field forward by using gePS to better capture polygenic risk across the genome, evaluating multiple socioeconomic risk factors, quantifying the effects of genetic and socioeconomic factors on T2D and obesity at both the individual and population level, and validating the relationship in two data sets from populations in developed nations and in non-European subsets, which have been excluded from most research in this field.
Regarding BMI, two prior studies examined the combined impact of genetic and environmental factors (including both socioeconomic and lifestyle factors) in subsets of the UKB of European ancestry. Each found positive multiplicative interactions between polygenic scores and Townsend Deprivation Index (5,39). We observed a weakly significant negative multiplicative interaction between genetic and socioeconomic risk on binary obesity in our UKB-European subset replication analysis; however, we found a positive interaction, consistent with prior studies, in a sensitivity analysis using continuous BMI rather than binary obesity as the outcome (Supplementary Table 19). We believe the reversal of this interaction may arise from dichotomization of BMI, as interactions between genetic and socioeconomic risk became progressively more negative at higher BMI thresholds (Supplementary Table 20). In other words, the relative impact of socioeconomic risk on BMI diminishes as genetic risk for high BMI increases, so differences related to socioeconomic status are seen mainly among people who have normal or only slightly elevated BMI; for example, examining a BMI cutoff of 30 will fail to detect the impact of socioeconomic risk that might be associated with a BMI increase from 24 to 26 kg/m2 in an individual with low genetic risk for obesity.
Regarding T2D, two prior studies evaluated the effects of genetic and socioeconomic factors in UKB. Both factors were shown to improve the predictive value of clinical scores for diabetes (6) and to interact with one another, leading to decanalization, or more severe phenotypes, in people at extreme socioeconomic risk (7). Another recent study quantified the interactions between polysocial, lifestyle, and genetic risk scores on the incidence of T2D in UKB participants (40); although this study examined incident T2D and excluded participants with prevalent T2D, it found results very similar to our study, with 15% of new-onset cases attributable to additive interactions between genetic and socioeconomic risk factors. Each of these studies examined interactions only in those of European ancestry.
The strengths of our analysis include large sample size and replication of results in a second data set in a country with distinct socioeconomic strata and in populations routinely underrepresented in biomedical research. Limitations include an observational, cross-sectional framework such that we are unable to prove causality and attributable risk. Second, both data sets have well-appreciated selection bias, with the MGBB representing an older, more female, and less racially/ethnically diverse population with higher health care utilization compared with the general population served by the hospital (8) and with the UKB representing an older, more female, less socioeconomically deprived, and healthier population compared with the general population of the U.K. (41). Third, the gePS for BMI used in this analysis was derived from data in the UKB, which may lead to an overestimation of the effect of genetic risk of obesity in analyses within this data set; this is not a concern for MGBB subsets. Fourth, the use of distinct definitions of socioeconomic risk and disease phenotype in the two data sets limits comparability, although it increases external validity. Fifth, the use of area-level proxies of socioeconomic risk, rather than self-reported measures, has limitations; however, validation analyses in a subsample with self-reported measures of socioeconomic risk demonstrated a concordance between self-reported and area-level measures of socioeconomic risk and replicated the results of our primary analysis (Supplementary Tables 5 and 15 and Supplementary Fig. 7). Finally, analyses in populations of non-European ancestry are limited in several ways, including small sample size and the limited predictive value of gePS derived in European subsets when applied to non-European subsets (25); these analyses should be viewed as exploratory.
In conclusion, this study demonstrates that combined high genetic and area-level socioeconomic risk is associated with more than triple the prevalence of T2D and obesity, with evidence of positive additive interactions between these factors in some populations. Further studies are needed to understand whether interventions to improve socioeconomic deprivation can decrease metabolic disease at the individual and community levels, especially among those with concomitant high genetic risk.
See accompanying article, p. 916.
This article contains supplementary material online at https://doi.org/10.2337/figshare.21754235.
Article Information
Acknowledgments. This research has been conducted using data from the Mass General Brigham Biobank (https://biobank.massgeneralbrigham.org) and UK Biobank (application 27892), a major biomedical database (www.ukbiobank.ac.uk).
Funding. S.J.C., J.M.M., M.S.U., J.C.F., and J.B.C. were supported by the National Institutes of Health (grants T32DK007028 and F32DK127545, U01HG011723, K23DK114551, K24HL157960, and K99DK127196, respectively). J.M.M. was also supported by the American Diabetes Association Innovative and Clinical Translational Award 1-19-ICTS-068. J.M. was partially supported by the American Diabetes Association (7-21-JDFM-005) and the National Institutes of Health (P30DK040561). A.K.M. was supported by the National Institutes of Health (grants R01 HL145025 and U01 HG011723). M.S.U. was also supported by the Massachusetts General Hospital Department of Medicine Transformative Scholars Award.
The content is solely the responsibility of the authors and does not necessarily represent the official views of the National Institutes of Health.
Duality of Interest. S.J.C. reports a close family member employed by a Johnson & Johnson company. No other potential conflicts of interest relevant to this article were reported.
Author Contributions. S.J.C., J.M., and M.S.U. conceived of and designed the study. S.J.C. collected and analyzed data, with support from C.M.L., J.Me., T.D.M., P.S., J.B.C., A.K.M., J.M.M., and M.S.U., and drafted the manuscript. All authors reviewed and provided critical feedback on the manuscript. S.J.C. is the guarantor for this work and, as such, had full access to all the data in the study and takes responsibility for the integrity of the data and the accuracy of the data analysis.