


To investigate the contribution of alterations in brain structure and function to cognitive function and their interactions in individuals with diabetes and patients with type 2 diabetes mellitus (T2DM).
This population-based study included 2,483 participants who underwent structural MRI (n = 569 with normal glucose metabolism [NGM], n = 1,353 with prediabetes, and n = 561 with T2DM) and cognitive testing. Of these, 2145 participants also underwent functional MRI (n = 496 NGM, n = 1,170 prediabetes, and n = 479 T2DM). Multivariate linear regression models were used to assess the association of brain volume and functional connectivity with cognition, as well as the association of brain volume and functional connectivity.
Compared with NGM participants, those with T2DM had lower brain volume in a wide range of brain regions and stronger functional connectivity between the bilateral thalamus and brain functional network (visual network and default mode network), and those with prediabetes had lower brain volume in specific local regions (subcortical gray matter volume and subcortical subregions [bilateral thalamus, bilateral nucleus accumbens, and right putamen]) and stronger functional connectivity between the right thalamus and visual network. Cognition was associated with greater right thalamus volume and lower functional connectivity between the right thalamus and visual network. Functional connectivity between the right thalamus and visual network was associated with lower right thalamus volume.
Cognition was associated with greater brain volume and lower functional connectivity in T2DM. Increased functional connectivity may indicate a compensatory mechanism for reduced brain volume that begins in the prediabetic phase.

Introduction
Type 2 diabetes mellitus (T2DM) triggers a well-described cascade of neurological disorders, including stroke, dementia, and depression, which may result in some degree of cognitive impairment (1,2). The pathogenesis of T2DM-related cognitive dysfunction is multifactorial and remains incompletely understood (3). Hyperglycemia may induce vascular endothelium dysfunction, which then increases the risk of cerebrovascular diseases (4), thus leading to brain structural abnormalities, including lacunar infarcts, white matter abnormalities, and brain atrophy (5). Atrophy in the brain regions has been reported to affect large-scale cortical communication, cognition, and perceptual function (6–8). This suggests that brain structural abnormalities may be key drivers of cognitive disturbance (9). T2DM studies have revealed not only structural volume abnormalities but also functional connectivity abnormalities (10–12). Increased connectivity between cortical and subcortical areas has been reported in T2DM (13). A meta-analysis revealed both structural and functional abnormalities in the cognitive control regions of the brain in some patients with psychiatric and neurological disorders (14). Despite these findings, the relationship between abnormalities of brain structure and function and cognitive dysfunction remains contentious. Changes in functional connectivity may promote cognition dysfunction but could also represent compensation for structural damage by the protective mechanism of the brain. Therefore, assessment of brain structural volume is insufficient to understand the underlying brain mechanisms of T2DM-related cognition completely. The existing literature lacks accurate assessments of diabetes status and joint analysis of multimodal MRI; the interaction between structural and functional changes in the brain has yet to be elucidated. Furthermore, existing studies of brain abnormalities in T2DM and prediabetes are usually limited by small sample size, leading to inconsistent findings (2). Studies with large sample sizes are needed to confirm and expand previous findings (15) and provide new insights into T2DM-induced cognitive impairment. These mechanisms in prediabetes, if explored, may provide a window of opportunity for delaying or preventing brain disease in individuals with T2DM (16).
In this study, we provide the first comprehensive analysis of brain abnormalities in a large population-based cohort of patients with T2DM and prediabetes using multimodal MRI. We aimed to study structural and functional brain alterations and their interactions and the cognitive consequences in T2DM and prediabetes. We hypothesized that the relationship between brain structural volume and functional connectivity in individuals with diabetes might indicate compensatory mechanisms that exist even in prediabetic brains.
Research Design and Methods
Study Population
The PRECISE (Polyvascular Evaluation for Cognitive Impairment and Vascular Events) study is an ongoing population-based prospective cohort study, with longitudinal collection of cardiovascular and cerebrovascular events and cognitive assessments. Participants in the PRECISE study included community-dwelling adults age 50–75 years based on cluster sampling from six villages and four communities of Lishui city in southeastern China (17). In the current study, data from the baseline assessment (May 2017 to September 2019) were used. In the baseline assessment, 3,067 participants were included, with 2,487 undergoing brain MRI scans. Four structural MRI (sMRI) scans were excluded from the study because of data processing errors, resulting in 2,483 sMRI scans included in the final analysis (flowchart in Supplementary Fig. 1). Of these, 2,145 functional MRI (fMRI) scans were included in the final analysis (flowchart in Supplementary Fig. 2). The PRECISE study was approved by the institutional review boards (IRBs) at all participating institutions, the ethics committee at Beijing Tiantan Hospital (IRB approval no. KY2017-010-01; Beijing, China), and the ethics committee at Lishui Hospital (IRB approval no. 2016-42; Lishui, China). All participants provided written informed consents before entering the study.
Prediabetes and T2DM Status
For all participants, fasting plasma glucose (FPG) and HbA1c were measured from fasting blood samples. Participants with a history of diabetes or treatment with hypoglycemic agents or insulin did not undergo the oral glucose tolerance test. Participants without a history of diabetes underwent a standardized oral glucose tolerance test (2 h, 75 g). For these individuals, fasting blood glucose level, HbA1c level, and medication information were used to determine prediabetes and T2DM status (flowchart in Supplementary Fig. 3). All tests were completed and centralized in Lishui City Central Hospital. Fasting glucose and postload glucose were measured by the enzymatic hexokinase method on two automatic analyzers (Abbott Architect C16000 and Abbott Architect I2000). HbA1c was measured by the ion-exchange chromatography method on an automatic analyzer (Tosoh INDIA HLC-723GB).
Prediabetes and T2DM status were defined according to the American Diabetes Association 2019 diagnostic criteria (18). Participants were considered to have prediabetes if they had an FPG ≥5.6 to 6.9 mmol/L or 2-h postload glucose ≥7.8 to 11.0 mmol/L or HbA1c ≥5.7 to 6.4% (39–47 mmol/mol). Diagnosis of T2DM was made by confirmation of self-reported diabetes that was previously diagnosed by a physician, current use of antidiabetic agents, FPG ≥7.0 mmol/L, 2-h postload glucose ≥11.1 mmol/L, or HbA1c ≥6.5% (48 mmol/mol). The remaining participants were considered to have normal glucose metabolism (NGM).
MRI Acquisition
Brain MRI data were acquired using a 3.0 Tesla MRI scanner (Ingenia 3.0T; Philips, Best, the Netherlands). Structural MRI data were acquired with high-resolution T1-weighted three-dimensional fast field echo structural scans (repetition time 6.7 ms; echo time 3.0 ms; voxel size 1 × 1 × 1 mm). Resting-state fMRI data were acquired with a gradient echo-planar imaging sequence. To reach steady state, six dummy scans were used before recording the data (repetition time 2,100 ms; echo time 30 ms; n = 38 slices; gap 0 mm; voxel size 3 × 3 × 4 mm; n = 180 volume measures).
Data Preprocessing
Preprocessing of sMRI data was performed by applying the FreeSurfer image analysis suite (https://surfer.nmr.mgh.harvard.edu) to T1-weighted MRI scans, which generated brain volumetric measures. In this report, we used the Desikan-Killiany atlas (19) for sMRI parcellation. FreeSurfer results were visually checked for segmentation and registration accuracy. The brain volumetric measures used in the current study included total brain gray matter volume, total white matter volume, gray matter and white matter volume in the left and right hemispheres, and deep subcortical gray matter volume (defined as total volume of the amygdala, hippocampus, caudate, pallidum, nucleus accumbens, putamen, and thalamus). We performed further functional connectivity analysis of regions with structural abnormalities demonstrated in prediabetes.
Preprocessing of fMRI data was performed using Statistical Parametric Mapping software (www.fil.ion.ucl.ac.uk/spm) and the Data Processing Assistant for Resting-State fMRI toolbox (20). The middle slice was used as the reference frame for slice timing. The fMRI time series was realigned using a six-parameter rigid-body spatial transformation to compensate for head movement effects. Functional and structural images were coregistered and warped to the Montreal Neurological Institute space. This was followed by resampling to 3-mm isotropic voxels, smoothening with a 6-mm full width at half-maximum Gaussian kernel, detrending, and band-pass filtering (0.01–0.08 Hz). The global mean signal, six head-motion parameters, mean signal in cerebrospinal fluid, and mean signal in white matter were regressed out as nuisance covariates to account for the effects of motion and nonneuronal blood oxygenation level–dependent fluctuations. The brain was parcellated into 246 regions (123 in each hemisphere) using the Human Brainnetome atlas (Supplementary Table 1), which provides information on functional connections based on the Desikan-Killiany atlas (21). We constructed brain network functional connectivity by calculating the Pearson correlation coefficient between each pair of brain regions and then converted to z scores using the Fisher r-to-z transformation. The whole-brain functional connectivity matrix for each participant was generated. The sparsity of the network was set at 0.15, which maintained the high connectedness of the brain networks and simultaneously removed as many spurious correlations as possible. The cerebral cortex was then mapped to seven functional networks according to the Yeo atlas (22), which included visual, somatomotor, dorsal attention, ventral attention, limbic, frontoparietal, and default mode networks (Fig. 1A).
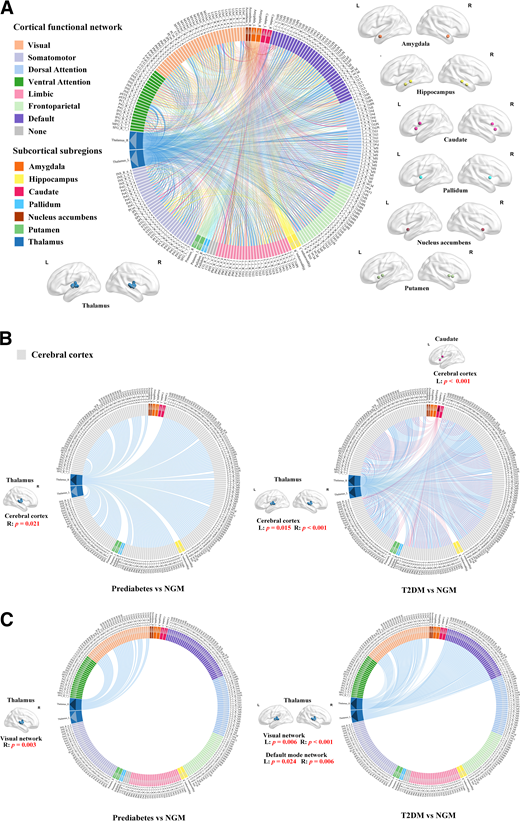
Schematic representation of functional connectivity between the cerebral cortex and subcortical subregions. A: Seven cortical functional networks were provided by the Yeo atlas (22). Subcortical subregions are indicated by white arrows, including the amygdala, hippocampus, caudate, pallidum, nucleus accumbens, putamen, and thalamus. Connection lines indicate connections between all subcortical subregions and the cerebral cortex. B: Compared with NGM participants, those with prediabetes had significantly stronger functional connectivity between the cortex and right thalamus, and those with T2DM had significantly stronger functional connectivity between the cortex and subcortical subregions, including the bilateral thalamus and left caudate. These subcortical subregions are indicated by black arrows; connection lines indicate connections between these subcortical subregions and the cerebral cortex. C: Compared with NGM participants, those with prediabetes and T2DM had significantly stronger functional connectivity between the bilateral thalamus and cortical functional networks. There was a significant increase in functional connectivity between the right thalamus and visual network in prediabetes. There was a significant increase in functional connectivity between the bilateral thalamus and visual network and functional connectivity between the bilateral thalamus and default mode network in T2DM. The bilateral thalamus is shown by black arrows; connection lines indicate connections between the thalamus and cortical functional networks. Details of the 246 regions in Human Brainnetome atlas (21) are provided in Supplementary Table 1. L, left; R, right.
Schematic representation of functional connectivity between the cerebral cortex and subcortical subregions. A: Seven cortical functional networks were provided by the Yeo atlas (22). Subcortical subregions are indicated by white arrows, including the amygdala, hippocampus, caudate, pallidum, nucleus accumbens, putamen, and thalamus. Connection lines indicate connections between all subcortical subregions and the cerebral cortex. B: Compared with NGM participants, those with prediabetes had significantly stronger functional connectivity between the cortex and right thalamus, and those with T2DM had significantly stronger functional connectivity between the cortex and subcortical subregions, including the bilateral thalamus and left caudate. These subcortical subregions are indicated by black arrows; connection lines indicate connections between these subcortical subregions and the cerebral cortex. C: Compared with NGM participants, those with prediabetes and T2DM had significantly stronger functional connectivity between the bilateral thalamus and cortical functional networks. There was a significant increase in functional connectivity between the right thalamus and visual network in prediabetes. There was a significant increase in functional connectivity between the bilateral thalamus and visual network and functional connectivity between the bilateral thalamus and default mode network in T2DM. The bilateral thalamus is shown by black arrows; connection lines indicate connections between the thalamus and cortical functional networks. Details of the 246 regions in Human Brainnetome atlas (21) are provided in Supplementary Table 1. L, left; R, right.
Statistical Analysis
The clinical characteristics of the participants are presented as mean ± SD, median with interquartile range (continuous variables), and percentage (categorical variables). Comparisons between glycemic metabolic groups (prediabetes, T2DM, and NGM) were based on ANOVA (continuous variables with normal distribution), the Kruskal-Wallis test (continuous variables with skewed distribution) and the Pearson χ2 test (categorical variables). A P value <0.05 was considered statistically significant.
Group differences were analyzed using two procedures of multivariate ANCOVA (MANCOVA) (with age, sex, and education level as covariates). The first MANCOVA determined if the three groups (prediabetes, T2DM, and NGM) differed with respect to brain structural volume. The second MANCOVA was computed to determine if the three groups differed with regard to brain functional connectivity between cortex and subcortical subregions. The MANCOVAs were followed by separate ANCOVAs for each dependent variable (with age, sex, and education level as covariates). Post hoc two-sample t tests, in a pairwise manner, within the areas identified by the ANCOVA, were used to identify differential abnormal brain regions among the three groups. Multiple comparison corrections were performed using the Bonferroni correction. All reported P values were based on two-sided tests, and P < 0.05 was considered statistically significant.
Multiple linear regression analysis was used to investigate the association of Montreal Cognitive Assessment (MoCA) score with brain volume and brain functional connectivity. Multiple linear regression analysis was used to investigate the association between brain volume and functional connectivity. Correlations were calculated for all participants. All data were standardized with the z score normalization method before regression. Analyses were adjusted for potential confounders, notably age (years), sex (male or female), and education level (illiteracy, elementary school, middle or high school, or college or above) (model 1) and additionally adjusted for BMI (continuous), hypertension (self-reported hypertension previously diagnosed by a physician, current use of antihypertensive agents, systolic blood pressure ≥140 mmHg, or diastolic blood pressure ≥90 mmHg), ratio of total to HDL cholesterol, history of stroke (yes or no), and history of heart disease (yes or no) (model 2). Finally, multiple linear regression analysis was used to evaluate the effect of brain structural volume and brain functional connectivity on cognition. Confounding variables (age, sex, education level, BMI, hypertension, ratio of total to HDL cholesterol, history of stroke, and history of heart disease) were regressed out in the model. All statistical analyses were performed using SAS 9.4 (SAS Institute, Inc., Cary, NC). P < 0.05 was considered statistically significant.
Data and Resource Availability
All data sets generated or analyzed in the current study are available from the corresponding authors on reasonable request.
Results
Study Sample Characteristics
The present report included cross-sectional data from 3,067 participants who completed the baseline assessment between May 2017 and September 2019. The sMRI data set included 569 (22.9%) participants with NGM, 1,353 (54.5%) with prediabetes, and 561 (22.6%) with T2DM (total N = 2,483). A cognitive assessment test was performed in 2,457 participants. The mean age of these participants was 61.4 years, and 53.4% were women. The sample characteristics are summarized in Table 1. Participants with prediabetes and T2DM were significantly older, had a lower education level, and had more cardiovascular risks compared with NGM participants.
Clinical characteristics of participants
| NGM | Prediabetes | T2DM | P | |
|---|---|---|---|---|
| Demographics | ||||
| Age, years | 59.8 ± 6.1 | 61.4 ± 6.5 | 63.2 ± 6.9 | <0.001 |
| Female sex, % | 52.5 | 53.5 | 54.4 | 0.813 |
| Glucose metabolism | ||||
| Fasting glucose, mmol/L | 5.1 ± 0.3 | 5.6 ± 0.5 | 7.8 ± 2.4 | <0.001 |
| 2-h postload glucose, mmol/L | 6.0 ± 1.1 | 7.3 ± 1.7 | 12.8 ± 3.7 | <0.001 |
| HbA1c, % | 5.4 ± 0.2 | 5.8 ± 0.3 | 7.1 ± 1.4 | <0.001 |
| HbA1c, mmol/mol | 35.4 ± 2.6 | 39.5 ± 3.4 | 54.5 ± 15.1 | <0.001 |
| Cardiovascular risk factors | ||||
| BMI, kg/m2 | 23.2 ± 2.7 | 24.0 ± 3.0 | 24.7 ± 3.2 | <0.001 |
| Systolic BP, mmHg | 124.7 ± 15.6 | 130.2 ± 15.6 | 135.3 ± 16.8 | <0.001 |
| Diastolic BP, mmHg | 73.6 ± 8.6 | 75.8 ± 9.0 | 76.8 ± 8.9 | <0.001 |
| Hypertension, % | 29.8 | 43.3 | 61.7 | <0.001 |
| Ratio of total to HDL cholesterol | 3.8 ± 1.1 | 4.1 ± 1.2 | 4.2 ± 1.1 | <0.001 |
| Triglycerides, mmol/L | 1.5 ± 1.1 | 1.8 ± 1.2 | 2.1 ± 1.5 | <0.001 |
| eGFR, mL/min/1.73 m2 | 103.0 ± 11.1 | 101.2 ± 13.0 | 101.6 ± 13.3 | 0.039 |
| History of stroke, % | 2.1 | 2.4 | 4.3 | 0.033 |
| History of heart disease, % | 5.8 | 8.4 | 12.1 | <0.001 |
| Medication use, % | ||||
| Lipid lowering | 1.9 | 4.0 | 8.4 | <0.001 |
| Antihypertensive | 17.1 | 25.6 | 40.3 | <0.001 |
| MoCA | 22.1 ± 4.6 | 21.5 ± 5.0 | 21.4 ± 4. 7 | 0.020 |
| Lifestyle factors, % | ||||
| Smoking status | 0.005 | |||
| Never | 63.7 | 68.5 | 68.1 | |
| Current | 23.8 | 19.9 | 16.2 | |
| Former | 12.5 | 11.6 | 15.7 | |
| Education level | 0.030 | |||
| Illiteracy or elementary school | 35.9 | 41.2 | 45.5 | |
| Middle or high school | 55.6 | 51.3 | 47.4 | |
| College or above | 8.5 | 7.5 | 7.1 |
Data are presented as mean ± SD or percentage. A total of 2,483 participants underwent sMRI, of whom 2,145 also underwent fMRI.
Fasting glucose values were available in n = 2,481. The 2-h postload glucose values were available in n = 2,209. HbA1c values were available in n = 2,481. Ratio of total to HDL cholesterol values were available in n = 2,481. Triglycerides values were available in n = 2,481. Estimated glomerular filtration rate values were available in n = 2,481. MoCA values were available in n = 2,457. BP, blood pressure.
Brain Structural Abnormalities in Prediabetes and T2DM
Statistically significant results of MANCOVA were seen for brain structural volume (Wilks Λ = 0.964; P < 0.001). Total gray matter, total white matter, left and right cortical gray matter, left and right cerebral white matter, and subcortical gray matter regions showed significant differences among the three groups (all P < 0.05). Additional pairwise comparisons among the three groups are shown in Table 2.
T2DM, prediabetes, and NGM brain volume measures
| Brain volume, cm3 | NGM (n = 569) | Prediabetes (n = 1,353) | T2DM (n = 561) | F | P |
|---|---|---|---|---|---|
| Total gray matter | 585.88 ± 39.9 | 581.88 ± 41.64 | 568.3 ± 38.46*† | 14.256 | <0.001 |
| Total white matter | 457.78 ± 43.42 | 453.56 ± 47 0.02 | 442.32 ± 42.02*† | 6.027 | 0.002 |
| Subcortical gray matter | 45.36 ± 3.37 | 44.88 ± 3.52‡ | 43.80 ± 3.33*† | 10.269 | <0.001 |
| Left cerebral cortex gray matter | 215.51 ± 16.22 | 213.93 ± 17.13 | 208.95 ± 15.8*† | 11.67 | <0.001 |
| Right cerebral cortex gray matter | 215.61 ± 16.24 | 214.26 ± 16.98 | 209.54 ± 15.79*† | 10.008 | <0.001 |
| Left cerebral white matter | 229.49 ± 21.9 | 227.32 ± 23.71 | 221.71 ± 21.21*† | 5.898 | 0.003 |
| Right cerebral white matter | 228.29 ± 21.64 | 226.25 ± 23.51 | 220.61 ± 20.96*† | 6.07 | 0.002 |
| Thalamus left | 7.11 ± 0.71 | 7.01 ± 0.73‡ | 6.76 ± 0.65*† | 11.961 | <0.001 |
| Thalamus right | 6.69 ± 0.59 | 6.6 ± 0.65‡ | 6.41 ± 0.59*† | 9.745 | <0.001 |
| Caudate left | 3.11 ± 0.38 | 3.07 ± 0.43 | 3.04 ± 0.39* | 2.285 | 0.102 |
| Caudate right | 3.18 ± 0.4 | 3.15 ± 0.43 | 3.13 ± 0.41 | 1.606 | 0.201 |
| Putamen left | 4.49 ± 0.49 | 4.45 ± 0.5 | 4.31 ± 0.5*† | 10.56 | <0.001 |
| Putamen right | 4.55 ± 0.49 | 4.48 ± 0.5‡ | 4.35 ± 0.5*† | 10.801 | <0.001 |
| Pallidum left | 1.99 ± 0.23 | 1.98 ± 0.24 | 1.99 ± 0.29 | 0.497 | 0.608 |
| Pallidum right | 1.97 ± 0.23 | 1.95 ± 0.24 | 1.95 ± 0.27 | 0.106 | 0.899 |
| Hippocampus left | 3.98 ± 0.33 | 3.96 ± 0.38 | 3.86 ± 0.34*† | 5.932 | 0.003 |
| Hippocampus right | 4.15 ± 0.36 | 4.13 ± 0.41 | 4.04 ± 0.37*† | 3.836 | 0.022 |
| Amygdala left | 1.55 ± 0.17 | 1.54 ± 0.19 | 1.5 ± 0.18*† | 3.616 | 0.027 |
| Amygdala right | 1.74 ± 0.18 | 1.72 ± 0.21 | 1.69 ± 0.19*† | 2.442 | 0.087 |
| Nucleus accumbens left | 0.37 ± 0.09 | 0.36 ± 0.09‡ | 0.34 ± 0.08*† | 13.116 | <0.001 |
| Nucleus accumbens right | 0.48 ± 0.07 | 0.46 ± 0.08‡ | 0.44 ± 0.07*† | 14.503 | <0.001 |
Data are presented as mean ± SD.
Diabetes vs. NGM (P < 0.05).
Diabetes vs. prediabetes (P < 0.05; Bonferroni corrected).
Prediabetes vs. NGM (P < 0.05).
Compared with those with NGM, individuals with prediabetes had significantly lower volume of subcortical gray matter (P = 0.015) and subcortical subregions, including the bilateral thalamus (left P = 0.009; right P = 0.009), bilateral nucleus accumbens (left P = 0.021; right P = 0.003), and right putamen (P = 0.024). Individuals with T2DM had significantly lower volume of total gray and white matter, left and right cortical gray matter, left and right cerebral white matter, subcortical gray matter regions, and all subcortical subregions except the bilateral pallidum and right caudate (all P < 0.05).
Compared with participants with prediabetes, those with T2DM had significantly lower volume of total gray and white matter, left and right cortical gray matter, left and right cerebral white matter, subcortical gray matter regions, and all subcortical subregions except the bilateral pallidum and bilateral caudate (all P < 0.05). All abovementioned comparisons among groups survived Bonferroni correction for multiple comparisons.
Brain Functional Abnormalities in Prediabetes and T2DM
Because the volume of subcortical structures was lower in prediabetes and T2DM, further analysis was focused on subcortical regions. We next investigated the functional connectivity of these structurally abnormal regions. Statistically significant results of MANCOVA were seen for brain functional connectivity between cortex and subcortical subregions (Wilks Λ = 0.980; P = 0.035). Functional connectivity between cortex and subcortical subregions, including the bilateral thalamus (left P = 0.024; right P = 0.001) and left caudate (P = 0.001), differed significantly among the three groups by ANCOVA. Results of the pairwise comparisons are presented in Fig. 1B. On the basis of the results of structural and functional analyses, we found that the thalamus showed reduced volume and increased functional connectivity in prediabetes. We further examined group differences in functional connectivity between the thalamus and cerebral cortex functional networks. Statistically significantly different functional connectivity between the visual network and bilateral thalamus (left P = 0.011; right P < 0.001) and between the default mode network and bilateral thalamus (left P = 0.026; right P = 0.007) among the three groups was shown by ANCOVA. Additional pairwise comparisons among the three groups showed that compared with NGM participants, those with prediabetes had significantly stronger functional connectivity between the visual network and right thalamus (P = 0.003). Individuals with T2DM had significantly stronger functional connectivity between the visual network and bilateral thalamus (left P = 0.006; right P < 0.001) and between the default mode network and bilateral thalamus (left P = 0.024; right P = 0.006) compared with those with NGM (Fig. 1C). There were no significant differences in functional connectivity of the thalamus and cortical functional networks between prediabetes and T2DM groups. All abovementioned comparisons among groups survived Bonferroni correction for multiple comparisons.
Associations of Cognition With Brain Volume
After full adjustment, no significant relationship was found between MoCA score and cortical gray matter volume (β = 0.03; 95% CI −0.003 to 0.062; P = 0.078). MoCA score was associated greater subcortical gray matter volume (β = 0.098; 95% CI 0.058–0.138; P < 0.001) and greater brain volume in the bilateral thalamus (left β = 0.108; 95% CI 0.070–0.147; P < 0.001; right β = 0.082; 95% CI 0.043–0.121; P < 0.001) (Supplementary Table 3).
Associations of Cognition With Brain Functional Connectivity
After full adjustment, MoCA score was associated with lower functional connectivity between the left thalamus and functional networks, including the somatomotor network (β = −0.048; 95% CI −0.083 to −0.013; P = 0.007) and ventral attention network (β = −0.040; 95% CI −0.076 to −0.005; P = 0.025), and higher functional connectivity between the left thalamus and limbic network (β = 0.040; 95% CI 0.005–0.075; P = 0.026). MoCA score was associated with lower functional connectivity between the right thalamus and visual network (β = −0.041; 95% CI −0.077 to −0.004; P = 0.029) (Supplementary Table 4).
Associations of Brain Volume With Brain Functional Connectivity
After full adjustment, left thalamic volume was associated with lower functional connectivity between the left thalamus and visual network (β = −0.075; 95% CI −0.124 to −0.026; P = 0.003). Right thalamic volume was associated with lower functional connectivity between the right thalamus and visual network (β = −0.064; 95% CI −0.113 to −0.015; P = 0.010) (Supplementary Table 5).
Influence of Brain Structural Volume and Brain Functional Connectivity on Cognition
After full adjustment, MoCA score was associated with greater right thalamus volume (β = 0.066; 95% CI 0.026–0.107; P = 0.001) and lower functional connectivity between the right thalamus and visual network (β = −0.033; 95% CI −0.069 to 0.002; P = 0.068).
Conclusions
In a large population-based study, we showed that individuals with T2DM had lower brain volume in widespread brain regions and stronger functional connectivity in specific brain regions, in comparison with those with NGM. Notably, these diabetes-related brain abnormalities were present even before clinical diagnosis of T2DM in individuals with prediabetes. Furthermore, cognitive function was associated with greater brain volume but lower functional connectivity; higher functional connectivity was associated with lower brain volume.
We found that participants with T2DM had lower total brain volume and regional brain volume, including total gray matter, total white matter and subcortical gray matter, and subcortical subregions. These results are consistent with those of previous studies (10). The pathological mechanisms by which T2DM may cause a reduction in brain volume include hyperglycemia, impaired insulin sensitivity, insulin resistance, amyloid β accumulation, τ hyperphosphorylation, inflammation, and oxidative stress (16,23); these characteristics resemble those of Alzheimer disease. Brain damage may result from reduced cerebral glucose metabolism or brain atrophy, deteriorating neurodegenerative diseases, or accelerating cognitive decline (24,25). We have expanded on existing studies of brain subcortical and subcortical subregions in T2DM. In our study, significant reduction was seen in the volume of all subcortical regions in those with T2DM, except in the bilateral pallidum and bilateral caudate regions. The results in those with prediabetes were more specific in region, such as the bilateral thalamus, bilateral nucleus accumbens, and right putamen. Perhaps atrophy of the subcortical area is associated with insulin dysregulation. Several studies have demonstrated that insulin receptors, which are widely distributed in the brain, can modulate neurogenesis, brain function, and energy balance (26). Expression of insulin receptors is highest in the cortex and some subcortical regions, including the thalamus, hippocampus, caudate, putamen, and amygdala, which play important roles in cognition (27). Furthermore, we found that cognition was associated with an increase in the volume of subcortical subregions, including the thalamus, putamen, pallidum, hippocampus, amygdala, and nucleus accumbens, independent of cortical volume. These results further suggest that the reduced volume of the subcortical subregions is associated with cognitive dysfunction. Reductions in the volume of the thalamus were already present in those with prediabetes, suggesting that brain mechanisms are already altered before the onset of diabetes. Disrupted connections between the cortical and subcortical regions may also cause cognitive impairment, depending on their participation in various brain regions (28). Our further analysis of subcortical subregions revealed that functional connectivity between the thalamus and cerebral cortex, including visual and default mode functional networks, was significantly enhanced in those with T2DM. Functional connectivity between the thalamus and visual network was significantly enhanced in those with prediabetes. Higher MoCA score was related to lower functional connectivity between the thalamus and visual network. This negative correlation may be caused by the volume effect. Accompanied by volume decline, reduced cognitive function and increased functional connectivity were found, suggesting that increased functional connectivity may be a compensatory mechanism in reduced volume associated with cognitive dysfunction. The current study showed that both structural volume and functional connectivity in the thalamus were altered in participants with prediabetes when compared with the control group and were closely linked to cognitive performance. Thalamic abnormalities are commonly found in neurological and psychiatric illnesses. However, structural and functional abnormalities may have different effects on cognitive function. Previous studies have shown that atrophy in the thalamus and other subcortical subregions contributes to cognitive impairment (29). We found that the volume of the thalamus was associated with lower functional connectivity between the thalamus and visual network. Although the estimated effect size for these correlations was small, the significant trends exhibited and the relative magnitude of effect size deserve further attention. These findings have important implications for potential mechanisms of diabetes impairment of cognition. Structural damage in the brain may be compensated for by functional reorganization (30); increased functional connectivity may be a significant compensatory mechanism for cognitive dysfunction related to brain atrophy and neurodegeneration in individuals with T2DM and prediabetes. Compared with participants with prediabetes, those with T2DM had significantly lower cortical and subcortical subregion volume, except for bilateral pallidum and bilateral caudate regions. Brain functional connectivity did not differ between prediabetes and T2DM groups, suggesting that this compensatory pattern may begin in prediabetes and persist in diabetes, but the difference in compensation between prediabetes and diabetes may not be significant. The compensatory mechanism of the thalamus and visual network connection was present in prediabetes, suggesting the existence of potentially abnormal features of visual information transmission before the onset of T2DM. Furthermore, the dynamic balance between the default mode network and other brain regions seems to be important for maintaining normal cognitive function. We suggest that increased functional connectivity between the thalamus and default network may be a compensatory mechanism in relation to reduced volume of the thalamus. This mechanism was not detected in prediabetic brains. This may be a sign of compensation or maladaptation (31), indicating that the degree of brain injury in prediabetes may be insufficient to trigger this compensatory mechanism in the default mode network (32).
Collectively, the current study provides new insights into cognitive mechanisms occurring in the brains of patients with T2DM and suggests the existence of enhanced functional connectivity through cortical and subcortical regions as a compensatory pattern for cognitive impairment related to structural brain damage. Strikingly, this compensatory pattern is already evident in prediabetic brains. Some cerebral small vessel diseases and neurodegenerative diseases, such as stroke, dementia, Alzheimer disease, and other diseases, often coexist in T2DM and may occur via a range of underlying mechanisms (33). We found the absolute value of β for structural volume was greater than the absolute value of β for functional connectivity in the multiple linear regression model, suggesting that brain structural volume has a greater effect on cognition than brain functional connectivity. This finding could provide new insights into the brain mechanisms of T2DM-related cognitive dysfunction, suggesting that structural brain volume merits closer attention in the prevention of T2DM-related cognitive changes.
The strengths of this study include a large population-based investigation that is reasonably representative of the general population. The prevalence of prediabetes (54.3%) and T2DM (22.7%) in the PRECISE study was similar to the prevalence reported in nationwide population-based surveys (prediabetes 57.7% and T2DM 22.5% in 2010 [34] and prediabetes 45.8% and T2DM 20.2% in 2013 [35] in the age range of 60–69 years) (36). We used multimodal MRI to perform a comprehensive analysis of brain functional and structural abnormalities in those with T2DM and prediabetes. The findings were robust and extended our current knowledge of the mechanisms underlying T2DM. However, we acknowledge that this study has some limitations. First, we did not collect detailed microvascular information or conduct detailed assessment for mild cognitive impairment or dementia; only MoCA was performed for baseline cognitive assessment. We will add full-dimensional microvascular information collection and cognitive assessment to the phase 2 follow-up data collection and analyze in detail. Second, because of the cross-sectional design of this study, we cannot infer any conclusions about how the development of diabetes affects brain abnormalities. We will continue to explore potential mechanisms of the cognitive impact of diabetes development in future longitudinal studies in PRECISE. Third, although we adjusted for many potential confounders, we cannot exclude residual confounding or the effect of unmeasured confounders, such as physical activity, diet, and alcohol; this should be done in future studies. Finally, this study is reliant on a Chinese community cohort and, therefore, should be combined with other population studies to generalize our conclusions.
In conclusion, we investigated brain structural and functional abnormalities in T2DM and prediabetes using a large population-based cohort. We demonstrated that smaller brain volume and stronger functional connectivity were present in the T2DM and prediabetic cortical and subcortical regions. Level of cognitive function is associated with greater brain volume and lower functional connectivity. These findings support the concept that increased brain functional connectivity may be a compensatory mechanism for cognitive dysfunction associated with reduced brain volume, beginning in prediabetes. The present research reported neuroimaging biomarkers for cognitive dysfunction in prediabetes. These findings will advance understanding of the cognitive mechanisms in individuals with T2DM and prediabetes and help to establish prevention strategies for neurological disorders in the prediabetes stage.
Clinical trial reg. no. NCT03178448, clinicaltrials.gov
This article contains supplementary material online at https://doi.org/10.2337/figshare.21912837.
J.Jin., C.L., and W.Z. contributed equally to this work.
Article Information
Acknowledgments. The authors thank the staff and participants of the PRECISE study for their important contributions.
Funding. This research received support from National Key R&D Program of China (grants 2016YFC0901002 and 2022YFC2504900), Chinese Academy of Medical Sciences Innovation Fund for Medical Sciences (grant 2019-I2M-5-029), Key Science & Technologies R&D Program of Lishui City (grant 2019ZDYF18), Zhejiang Provincial Program for the Cultivation of High-Level Innovative Health Talents, and Beijing Natural Science Foundation (grant Z200016).
Duality of Interest. This research received support from AstraZeneca Investment (China) Co., Ltd. No other potential conflicts of interest relevant to this article were reported.
Author Contributions. J.Jin., Y.P., T.L., and Yo.W. verified the quality and accuracy of research and clinical data. J.Jin. and T.L. conceptualized and designed the study. C.L. and W.Z. contributed to data analysis and manuscript writing. C.L., Y.P., and Y.J. contributed to statistical analysis. C.L. and Y.Z. contributed to quality control of the data. C.L., W.Z., Z.Z., J.C., H.N., and W.W. contributed to discussion and interpretation of the data. Y.P., J.Jia., X.C., Z.Z., Z.L., X.M., Yi.W., H.L., H.Z., S.W., and T.W. contributed to the data acquisition. Y.P., J.Jia., X.C., P.S.S., and T.L. contributed to critical revision of the report. T.L. and Yo.W. approved the final manuscript version. T.L. and Yo.W. are the guarantors of this work and, as such, had full access to all the data in the study and take responsibility for the integrity of the data and the accuracy of the data analysis.