


To examine whether the circulating substrate mix may be related to the incidence of heart failure (HF) and cardiovascular (CV) mortality and how it is altered by canagliflozin treatment.
We measured fasting glucose, free fatty acids (FFA), glycerol, β-hydroxybutyrate, acetoacetate, lactate, and pyruvate concentrations in 3,581 samples from the CANagliflozin cardioVascular Assessment Study (CANVAS) trial at baseline and at 1 and 2 years after randomization. Results were analyzed by univariate and multivariate Cox proportional hazards models.
Patients in the lowest baseline FFA tertile were more often men with a longer duration of type 2 diabetes (T2D), higher urinary albumin excretion, lower HDL-cholesterol levels, higher history of CV disease (CVD), and higher use of statins and insulin. When all seven metabolites were used as predictors, FFA were inversely associated with incident hospitalized HF (hazard ratio [HR] 0.33 [95% CI 0.21–0.55]), while glycerol was a positive predictor (2.21 [1.45–3.35]). In a model further adjusted for 16 potential confounders, including prior HF and CVD and pharmacologic therapies, FFA remained a significant negative predictor. FFA and glycerol also predicted CV mortality (HR 0.53 [95% CI 0.35–0.81] and 1.81 [1.26–2.58], respectively) and all-cause death (0.50 [0.36–0.70] and 1.64 [1.22–2.18]). When added to these models, background insulin therapy was an independent positive predictor of risk of death. Canagliflozin treatment significantly increased plasma FFA and β-hydroxybutyrate regardless of background antihyperglycemic therapy.
A constitutive metabolic setup consisting of higher lipolysis may be beneficial in delaying or preventing hospitalized HF; a further stimulation of lipolysis by canagliflozin may reinforce this influence.
Introduction
Cardiovascular (CV) outcome trials comparing treatment with sodium–glucose cotransporter 2 inhibitors (SGLT2i) with placebo on top of standard care in patients with type 2 diabetes (T2D) have uniformly reported marked reductions in hospitalized heart failure (hHF) and progression of renal disease, including sizeable, if less consistent, reductions of CV and all-cause mortality (1–5). There is a general consensus that these effects are in large part independent of the decrements in HbA1c, blood pressure, and body weight induced by SGLT2i therapy. Thus, a variety of mechanisms—hemodynamic, metabolic, renal, and hemopoietic—have been postulated in order to explain SGLT2i trial findings (6). The first and foremost action of SGLT2i, which justifies their primary indication, is to impede renal glucose reabsorption, thereby causing a large deficit in carbohydrate availability. The resulting metabolic switch from glucose to fat utilization at the whole-body level has been verified in humans (7). It has been posited that the enrichment of the substrate mix in plasma free fatty acids (FFA) and ketones (7,8) may be beneficial for myocardial energy production and transduction (9), and experimental evidence has been obtained in rodent (10), porcine (11), and canine (12) models of HF and in man following intravenous ketone infusions (13), short-term (6 months) SGLT2i treatment (14), and ex vivo analysis of explanted hearts (15). Supporting evidence from large, long-term CV outcome trials in T2D is, however, lacking.
In the present work, we used baseline plasma samples from the CANagliflozin cardioVascular Assessment Study (CANVAS)—a CV outcomes trial of canagliflozin compared with placebo in patients with T2D (2)—to measure major circulating substrates, including glucose, FFA, glycerol, β-hydroxybutyrate (βOH), acetoacetate (AcAc), lactate, and pyruvate. The choice of these metabolites was based on the well-established notion that FFA and glycerol are markers of lipolysis (i.e., complete hydrolysis of triglycerides, mostly in white adipose tissue), the lactate-to-pyruvate ratio marks the cytosolic redox balance, and the βOH-to-AcAc ratio reflects the mitochondrial redox state; these substrates form a communication network for metabolic regulation (16). The human heart is omnivorous (i.e., it normally uses all these substrates for energy production) (17). We therefore hypothesized that baseline metabolites might be associated with the CV outcomes of the trial. Furthermore, as CANVAS plasma samples obtained 1 and 2 years into the trial were available, we tested whether canagliflozin-induced changes in these metabolites might also associate with CV outcomes.
In all CV outcome trials of SGLT2i, the effect of treatment on HF was evident early (a few weeks) after randomization, suggesting that patients with cardiac decompensation requiring hospital admission were more likely to benefit from treatment (1–5,18). We focused on HF rather than major adverse CV events (MACE), which is a composite of fatal and nonfatal events in disparate CV districts (19).
Research Design and Methods
The CANVAS Program integrated two trials, CANVAS and CANVAS-R, involving a total of 10,142 participants with T2D and high CV risk. Details of the program design and oversight, participants, inclusion and exclusion criteria, randomization, treatment, follow-up, and outcomes have been published (1). Incident HF was coded as first hHF occurring after randomization; in individuals with a previous history of HF, hHF was a repeat episode. In the CANVAS study, fasting blood samples were obtained at baseline (from 2,387 subjects in the treatment arm and 1,194 in the placebo arm, totaling 83% of the original cohort) and at year 1 (2,022 and 949 subjects, respectively) and year 2 (1,793 and 834 subjects, respectively). After centrifugation and separation, the plasma samples were stored at −80°C. In October 2019, the samples were transferred to the Metabolism Unit of the Department of Clinical and Experimental Medicine at University of Pisa, Italy, for metabolite measurements. Paired samples from the baseline, year 1, and year 2 collections were assayed in the same run; laboratory operators were blinded to the patients’ data.
Analytical Methods
FFA were measured on a Beckman UniCel DXC600 Synchron Analyzer (Beckman Coulter, Fullerton, CA), with the enzymatic colorimetric kit NEFA-HR(2) from Wako Diagnostics (Wako Chemicals USA, Richmond, VA). Glycerol was measured on the Beckman UniCel DXC600 Synchron Analyzer, with a modified enzymatic method for the determination of triglycerides (TG- REF445850; Beckman Coulter, Brea, CA). Lactate, βOH, and AcAc were measured in whole plasma and pyruvate in deproteinized plasma samples, by in-house automated spectrophotometric enzymatic methods on a Beckman UniCel DXC600 Synchron Analyzer (20,21). Within-assay and between-assay coefficients of variation ranged between <1% and <7% for all metabolites.
Statistical Analysis
Given the exploratory nature of this project, no statistical analysis plan was prespecified; all available data were included in the analyses. Data are summarized as mean ± SD or median (interquartile range) for variables with a skewed distribution by the Shapiro-Wilk test; these latter variables were transformed into their natural logarithms for use in statistical analysis. Mean group values were compared by ANOVA or the Wilcoxon signed rank test, depending on the distribution of the variable; frequencies were compared by the χ2 test. Cumulative incidence of events is shown as Kaplan-Meier plots. Multivariate Cox proportional hazards models were used to test the association of predictor variables with events. Hazard ratios (HR) and their 95% CIs were calculated for 1 SD for predictor variables with a normal distribution and 1 log unit for predictor variables with a skewed distribution. Initial multivariate Cox models included all seven metabolites (glucose, FFA, glycerol, lactate, pyruvate, βOH, and AcAc); fully adjusted models also included the following 16 clinical variables: sex, age, BMI, baseline HbA1c, urinary albumin-to-creatinine ratio (UACR), estimated glomerular filtration rate (eGFR), systolic blood pressure, LDL and HDL cholesterol, use of diuretics, statins, antithrombotics, and renin-angiotensin-aldosterone-system (RAAS) inhibitors, and history of HF, prior CV disease (CVD), and cigarette smoking. Participants in the CANVAS trial were randomly assigned in a 1:1:1 ratio to receive canagliflozin at a dose of 300 mg or 100 mg, or matching placebo; the two treatment dose arms were combined for analysis. Time course of metabolites by treatment was analyzed by two-way ANOVA for repeated measures; results were plotted as least-squares mean and 95% CI. A nominal P value ≤0.05 was considered significant. Analyses were performed using JMP 9.0.1 and R software.
Results
Among the baseline substrates, the strongest associations were between FFA and glycerol (lipolysis couple), lactate and pyruvate (cytosolic redox couple), and βOH and AcAc (mitochondrial redox couple). Intraindividual correlations for each substrate over 2 years (baseline, year 1, and year 2 data) were remarkably robust (with correlation coefficients ranging from 0.40 to 0.63) regardless of treatment assignment. Treatment-induced changes in circulating substrates have been previously shown to occur already following the first drug dose (7) and to stabilize thereafter (8). Those measured at years 1 and 2 in the current study can therefore be thought as occurring soon after randomization.
HF
Median follow-up of the entire cohort was 6.1 (0.6) years; among the 136 individuals who experienced a first postrandomization hHF, the median time was 3.3 (3.8) years. A history of HF was present in 480 subjects (13% of all participants) and in 33% of patients developing hHF, a more than triple risk compared with patients not developing hHF (HR 3.55 [95% CI 2.44–5.09]; P = 5.9e-10).
Baseline plasma FFA concentrations were lower in patients developing hHF compared with the rest of the cohort (447 [293] vs. 478 [284] µmol/L, P = 0.039). Furthermore, within the group of patients with a history of HF, those who went on to develop hHF had lower FFA than those who did not (416 [269] vs. 504 [323] µmol/L, P < 0.05).
The clinical and metabolic profile by tertile of baseline plasma FFA is shown in Table 1. Patients in the lowest tertile were more often men with a longer duration of T2D, higher urinary albumin excretion, lower HDL-cholesterol levels, higher history of CVD and myocardial infarction (MI), and higher use of statins and insulin. Baseline FFA were strongly associated with incident hHF in a reciprocal manner (Fig. 1). When the baseline concentrations of all seven measured metabolites were used as continuous variables, FFA were still inversely associated with incident hHF (P < 0.0001), but now glycerol and AcAc were also independently predictive in a direct manner (P < 0.001 and P = 0.04, respectively) (Table 2). In the fully adjusted model, FFA remained a significant negative predictor of incident HF (P = 0.031), with glycerol achieving borderline significance (Fig. 2). From the model, each decrement in baseline FFA log-unit concentration (172 µmol/L) predicted a doubling of incident hHF risk (HR 2.08 [95% CI 1.14–3.70]) independently of all covariates.

Kaplan-Meier plot of time to first hHF by tertile (tert.) of baseline fasting plasma FFA concentration.
Kaplan-Meier plot of time to first hHF by tertile (tert.) of baseline fasting plasma FFA concentration.
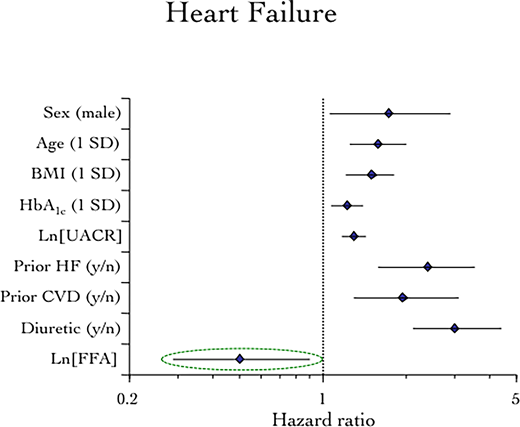
Multivariate Cox proportional hazards model of the association of baseline fasting plasma FFA with incident hHF. Additional statistically not significant covariates (eGFR, smoking, HDL and LDL cholesterol, systolic blood pressure, and use of statins, antithrombotics, and RAAS inhibitors) are not plotted.
Multivariate Cox proportional hazards model of the association of baseline fasting plasma FFA with incident hHF. Additional statistically not significant covariates (eGFR, smoking, HDL and LDL cholesterol, systolic blood pressure, and use of statins, antithrombotics, and RAAS inhibitors) are not plotted.
Clinical and metabolic characteristics of the CANVAS cohort by tertile of baseline plasma FFA concentrations
| Lower FFA tertile | Middle FFA tertile | Higher FFA tertile | P | |
|---|---|---|---|---|
| Male sex (%) | 77 | 68 | 55 | 0.0274 |
| Age (years) | 62.3 ± 8.0 | 62.7 ± 7.6 | 63.0 ± 7.9 | 0.0310 |
| BMI (kg/m2) | 32.1 ± 5.9 | 32.7 ± 6.1 | 33.2 ± 6.3 | 0.0001 |
| Fat mass (%) | 32.3 ± 4.9 | 32.9 ± 4.9 | 33.4 ± 5.5 | 0.0031 |
| eGFR (mL/min/1.73 m2) | 77.9 ± 18.6 | 75.2 ± 19.0 | 77.9 ± 18.6 | 0.0006 |
| T2D duration (years) | 14.1 ± 7.7 | 13.3 ± 7.4 | 13.3 ± 7.5 | 0.0122 |
| HbA1c (%) | 8.15 ± 0.91 | 8.09 ± 0.89 | 8.23 ± 0.92 | 0.0006 |
| UACR (mg/g) | 113 ± 9 | 66 ± 9 | 76 ± 10 | 0.0010 |
| Blood pressure | ||||
| Systolic (mmHg) | 135 ± 16 | 136 ± 16 | 139 ± 16 | <0.0001 |
| Diastolic (mmHg) | 76 ± 10 | 77 ± 10 | 79 ± 10 | <0.0001 |
| HDL cholesterol (mmol/L) | 1.16 ± 0.31 | 1.18 ± 0.29 | 1.25 ± 0.35 | <0.0001 |
| LDL cholesterol (mmol/L) | 2.21 ± 0.90 | 2.28 ± 0.91 | 2.35 ± 0.95 | 0.0024 |
| Glucose (mmol/L) | 8.74 ± 2.50 | 9.33 ± 2.45 | 9.92 ± 2.45 | <0.0001 |
| FFA (µmol/L) | 285 ± 75 | 480 ± 55 | 762 ± 174 | <0.0001 |
| Glycerol (µmol/L) | 45 ± 22 | 65 ± 27 | 99 ± 45 | <0.0001 |
| Lactate (mmol/L) | 1.96 ± 0.74 | 2.07 ± 0.75 | 2.19 ± 0.78 | <0.0001 |
| Pyruvate (µmol/L) | 176 ± 54 | 179 ± 53 | 182 ± 51 | 0.0244 |
| Lactate-to-pyruvate ratio | 11.7 ± 6.7 | 12.2 ± 9.3 | 12.3 ± 4.6 | NS |
| βOH (µmol/L) | 134 ± 90 | 205 ± 137 | 377 ± 324 | <0.0001 |
| AcAc (µmol/L) | 33 ± 16 | 43 ± 22 | 65 ± 40 | <0.0001 |
| βOH-to-AcAc ratio | 4.7 ± 4.8 | 5.4 ± 5.0 | 6.7 ± 12.9 | <0.0001 |
| Prior CVD (%) | 65 | 59 | 54 | <0.0001 |
| Prior MI (%) | 30 | 27 | 22 | <0.0001 |
| Prior HF (%) | 12 | 13 | 15 | 0.0422 |
| Smokers (%) | 19 | 18 | 17 | NS |
| Medication use | ||||
| Loop or nonloop diuretics (%) | 44 | 46 | 50 | 0.0270 |
| Antithrombotics (%) | 77 | 72 | 68 | <0.0001 |
| Statins (%) | 78 | 75 | 70 | <0.0001 |
| RAAS inhibitors (%) | 81 | 81 | 82 | NS |
| β-Blockers (%) | 52 | 50 | 51 | NS |
| Insulin (%) | 61 | 49 | 47 | <0.0001 |
| Metformin (%) | 68 | 75 | 74 | <0.0001 |
| Sulfonylureas (%) | 39 | 44 | 48 | <0.0001 |
Data are presented as mean ± SD unless indicated otherwise. P values by ANOVA or χ2.
Association of baseline substrates with CV outcomes
| HF (n = 136) | CV death (n = 271) | HF or CV death (n = 352) | All deaths (n = 398) | Nonfatal MI (n = 209) | |
|---|---|---|---|---|---|
| Glucose | 0.89 (0.46–1.75) | 1.04 (0.65–1.68) | 1.10 (0.73–1.65) | 0.94 (0.64–1.38) | 1.50 (0.86–2.63) |
| FFA | 0.33 (0.21–0.55) | 0.40 (0.29–0.58) | 0.40 (0.29–0.54) | 0.40 (0.30–0.54) | 1.29 (0.80–2.12) |
| Glycerol | 2.21 (1.45–3.35) | 2.07 (1.53–2.78) | 2.12 (1.64–2.74) | 1.85 (1.45–2.36) | 0.87 (0.61–1.24) |
| βOH | 0.87 (0.61–1.25) | 1.01 (0.78–1.32) | 1.00 (0.80–1.25) | 1.08 (0.88–1.35) | 0.73 (0.56–0.96) |
| AcAc | 1.60 (1.02–2.56) | 1.38 (1.01–1.91) | 1.36 (1.04–1.79) | 1.32 (1.02–1.72) | 1.21 (0.86–1.73) |
| Lactate | 1.47 (0.80–2.70) | 1.46 (0.96–2.21) | 1.40 (0.98–2.01) | 1.39 (0.99–1.95) | 0.82 (0.51–1.32) |
| Pyruvate | 1.08 (0.56–2.24) | 0.72 (0.48–1.13) | 0.90 (0.61–1.36) | 0.68 (0.49–0.97) | 1.02 (0.61–1.80) |
| Glucose-adj | 0.53 (0.27–1.08) | 0.79 (0.48–1.33) | 0.75 (0.49–1.16) | 0.81 (0.54–1.23) | 1.10 (0.60–2.02) |
| FFA-adj | 0.50 (0.28–0.94) | 0.53 (0.35–0.81) | 0.55 (0.39–0.79) | 0.50 (0.36–0.70) | 1.82 (1.09–3.09) |
| Glycerol-adj | 1.63 (0.96–2.75)† | 1.81 (1.26–2.58) | 1.79 (1.31–2.44) | 1.64 (1.22–2.18) | 0.72 (0.47–1.10) |
| βOH-adj | 0.93 (0.65–1.36) | 1.06 (0.81–1.39) | 1.08 (0.86–1.36) | 1.08 (0.87–1.35) | 0.78 (0.60–1.02)† |
| AcAc-adj | 1.06 (0.66–1.71) | 1.12 (0.81–1.57) | 1.01 (0.77–1.35) | 1.14 (0.88–1.49) | 0.97 (0.69–1.38) |
| Lactate-adj | 1.18 (0.66–2.17) | 1.03 (0.68–1.58) | 0.97 (0.68–1.39) | 1.16 (0.83–1.64) | 0.75 (0.46–1.23) |
| Pyruvate-adj | 1.79 (0.87–3.85) | 1.27 (0.77–2.13) | 1.61 (1.05–2.53) | 1.02 (0.70–1.52) | 1.22 (0.70–2.18) |
Entries are HRs and 95% CI (per 1 log unit of the predictor). Statistically significant HRs are highlighted in bold. adj, adjusted for sex, age, BMI, eGFR, HbA1c, systolic blood pressure, prior CVD, prior HF, smoking, UACR, HDL cholesterol, LDL cholesterol, and use of statins, RAAS inhibitors, antithrombotics, and loop diuretics, in addition to all seven log-transformed substrates.
P = 0.08.
CV Death
A total of 271 adjudicated CV deaths (including 38 fatal MIs and 23 fatal strokes) occurred at a median follow-up time of 3.5 (3.2) years. In univariate analysis, baseline FFA concentrations were inversely predictive of CV death. In multivariate analysis of all seven metabolites, FFA were still inversely associated with CV death (P < 0.0001), and glycerol was predictive in a direct manner (P < 0.0001) (Table 2). In the fully adjusted model, both FFA and glycerol remained significantly associated with CV death in opposite directions (Supplementary Fig. 1).
For the combined outcome of hHF/CV death, the fully adjusted model results were similar to those of CV death alone: low FFA and high glycerol were positive risk predictors (Supplementary Fig. 2). The same was true of all-cause mortality (Supplementary Fig. 3).
Nonfatal MI
A history of MI was present in 26% of the participants and in 43% of the patients with a history of HF. A total of 209 acute nonfatal MIs occurred at a median follow-up time of 2.8 (3.1) years; 41% of patients developing a nonfatal MI had a history of MI, and 11% of them were also hHF at follow-up.
In multivariate analysis of all seven substrates, baseline βOH levels were inversely predictive of nonfatal MI (P = 0.027) (Table 2). In the fully adjusted model, both βOH and FFA were significantly associated with nonfatal MI in opposite directions.
Treatment
Canagliflozin treatment was not significantly associated with any of the CV outcomes, although the HRs all tended to be less than unity (Supplementary Table 1). As stated in the Research Design and Methods, this cohort was underpowered to show the treatment effects found with the full CANVAS program.
At years 1 and 2, FFA had risen significantly more with canagliflozin than with placebo (P < 0.002), whereas glycerol was stable. Lactate decreased slightly with treatment, while pyruvate increased in the placebo arm (P < 0.001), but the lactate-to-pyruvate ratio was not significantly changed by treatment. βOH and AcAc both increased with treatment (P < 0.0001 for both compared with placebo), as did their ratio (P = 0.019 at year 1). Of interest, baseline FFA, βOH, and AcAc levels were lower (P < 0.0001) in patients on treatment with insulin (i.e., 52% of the entire cohort) than in the remainder of the cohort; the opposite was true (P < 0.0001) in patients on treatment with metformin (i.e., 72% of total). Yet, the absolute canagliflozin-induced increments in these substrates were similar between these two subgroups (Supplementary Fig. 4). In general, the pattern of treatment-induced substrate changes was similar regardless of baseline antihyperglycemic therapy, including sulfonylureas (44% of total) and combination therapy (61% of total).
Despite the smaller number of cases/events in the year 1 data set (due to 587 missing samples), the pattern of associations of metabolites with CV outcomes (Supplementary Table 1) generally reproduced the results of the full cohort. Thus, year 1 FFA were inversely, and year 1 glycerol was directly, associated with the combined outcome of hHF/CV death.
In univariate analysis, use of insulin was a positive predictor of hHF (HR 1.75 [95% CI 1.22–2.53]), hHF/CVD (HR 1.70 [95% CI 1.37–2.12]), CV death (HR 1.89 [95% CI 1.47–2.45]), all-cause death (HR 1.60 [95% CI 1.30–1.96]), and nonfatal MI (HR 1.33 [95% CI 1.01–1.75]). When added to the fully adjusted model, insulin use was still an independent positive predictor of hHF/CVD (HR 1.27 [95% CI 1.00–1.62]), CV death (Supplementary Fig. 1), and all-cause death (HR 1.28 [95% CI 1.02–1.61]), but did not cancel the reciprocal predictivity of baseline FFA.
Conclusions
The principal findings of the current study are the associations of baseline, pretreatment concentrations of major circulating substrates with CV outcomes in the CANVAS cohort. First and foremost, higher fasting plasma FFA were associated with an ∼50% relative risk reduction of hHF even after controlling for all the potential confounders assessed in the trial. Previous observational studies in cohorts without diabetes have been inconclusive. Thus, in men and women free of HF at baseline from the Cardiovascular Health Study, fasting FFA were associated with a higher risk of HF in older (≥65 years) adults (22). Conversely, in the Multi-Ethnic Study of Atherosclerosis study, FFA were inversely, but not statistically significantly, associated with HF with reduced ejection fraction, regardless of adjustment (23). To our knowledge, the current finding in a cohort of patients with T2D has not been previously reported (nor could it be unarguably anticipated).
FFA are the main energy substrate for the heart (24,25). In T2D (26) and HF (27) alike, cardiac glucose uptake is impeded by the presence of insulin resistance, whereas FFA are transported into myocardiocytes down a concentration gradient (28). While myocardial substrate selection and energetics are accepted as important determinants of contractile activity, metabolic data in HF vary by species, methodology, and HF etiology and stage (29). There is, however, consensus that in humans, HF deterioration of contractile function is marked by a progressive impairment of FFA oxidation (30) as the failing heart slides into energy deficiency (31,32). In this condition, reduced cardiac FFA use could be due to relative inability to oxidize them or to lower FFA delivery (or both). The current finding that higher baseline FFA availability is associated with reduced HF risk implies that they could be used by the myocardium to alleviate or delay mechanical failure. In support of this potential explanation is the study by Santos-Gallego et al. (11), which showed that in a porcine model of postischemic HF, 2 months of empagliflozin treatment increased myocardial uptake of both FFA and ketones.
There are important constraints to the interpretation of fasting samples: 1) substrate concentrations and not fluxes were measured, 2) amino acids, which the heart takes up efficiently (17,33), were not measured, and 3) circulating substrate levels reflect handling in multiple organs. However, the marked intraindividual correlations of all measured substrates over 2 years indicated a surprising stability of the individual metabolic setup. Furthermore, all measured substrates were included together in the predictive models so that their values competed for statistical association with outcomes as their circulating concentrations do for tissue uptake. Finally, the postrandomization (year 1) data confirmed the FFA association with incident hHF. Therefore, one plausible mechanism whereby SGLT2i may improve HF prognosis is the treatment-induced increase in circulating FFA (Fig. 2). Despite the fact that canagliflozin changed the concentration of other substrates, FFA carried an overriding weight in relation to hHF events. Therefore, a more specific interpretation of the FFA finding in CANVAS is that a constitutive metabolic setup consisting of higher lipolysis was beneficial in delaying or preventing hHF in patients with T2D; a further stimulation of lipolysis by canagliflozin reinforced this influence.
When CV death was analyzed—alone, as a composite with HF, or as part of all-cause mortality—FFA were still negative predictors and plasma glycerol emerged as an independent, positive predictor in the entire cohort as well as in the year 1 data. Complete hydrolysis of triglycerides yields a 3:1 mole-by-mole ratio of FFA to glycerol. However, plasma glycerol clearance is much faster than plasma FFA clearance (7,34), whereby the plasma FFA-to-glycerol ratio is normally >3 (7.7 [4.0] in the present data set). Glycerol disposal occurs principally (∼75%) in the liver, with the kidney contributing up to one-fifth of total body capacity (35). Given the liver congestion and fibrosis that is associated with chronic HF or imminent cardiac decompensation (36), one can speculate that the high glycerol levels may be a biomarker of a degree of hepatic dysfunction and/or renal impairment.
Another finding was the association of higher, rather than lower, FFA with nonfatal MI along with a protective role of higher βOH. Excess FFA oxidation imposes an adverse oxygen strain on a myocardium under strong ischemic challenge (27,28), while increased βOH provides an additional substrate that is energetically thrifty compared with FFA (9). The variability of the metabolic circumstances of an acute MI prevents us from making more direct inferences. Nonetheless, the operational metabolic model emerging from our data is one where a more reduced redox status appears to be protective against both cardiac outcomes (16,37).
Insulin is a potent controller of lipolysis and ketogenesis (38). As shown in Supplementary Fig. 4, patients on background insulin treatment had lower levels of FFA and βOH at baseline and follow-up compared with metformin. It could be argued that use of insulin interferes with the positive impact of this substrate setup. In fact, when included in the fully adjusted Cox model, background insulin therapy (52% of subjects) carried an independent risk of death. However, this finding may also simply reflect a classical indication bias, whereby insulin is used, alone or in combination, in patients with more advanced T2D. Retrospective and prospective studies have failed to convincingly show improved CVD prognosis with chronic insulin treatment (24), and a very large trial in individuals with impaired fasting glucose, impaired glucose tolerance, or T2D showed that insulin glargine had no effect on CV outcomes (39). A definitive call on this issue may be prohibitively difficult to obtain given that insulin treatment has both beneficial effects (glucose lowering, anti-inflammatory, nitric oxide–dependent vasodilatory, sodium retentive, etc.) and potentially negative effects.
Two concluding caveats: First, the metabolic mechanisms emerging from the current analysis do not in any way conflict with the operation of different mechanisms (e.g., hemodynamic [40]) of cardioprotection by SGLT2i. Second, the pattern of substrate associations we reported is the result of stringent filtering of signals by the use of extensive statistical adjustment. Weaker, but nonetheless, important signals may be lost in the process. For example, pyruvate and lactate concentrations (Table 2 and Supplementary Table 1) may convey additional insight into the network of substrate utilization in relation to complex end points. Additional studies of available large trials are feasible, and their results might help tailoring the management of CV disease to more specific patient phenotypes.
Clinical trial reg. no. NCT01032629, clinicaltrials.gov
This article contains supplementary material online at https://doi.org/10.2337/figshare.19747645.
Article Information
Acknowledgments. The authors thank all patients and CANVAS investigators for their tremendous support in the trial. Technical editorial support was provided by Alaina Mitsch, PhD, of MedErgy, and was funded by Janssen Research & Development, LLC.
Funding. G.A.F. reports receiving research support from the co-funded National Health and Medical Research Council and Heart Foundation (Australia) Practitioner Fellowship and the Heart Research Australia. B.N. is supported by an Australian National Health and Medical Research Council Principal Research Fellowship.
Duality of Interest. CANVAS was sponsored by Janssen Research and Development, LLC, and was conducted as a collaboration between the sponsor, an academic steering committee, and an academic research organization, George Clinical. Canagliflozin was developed by Janssen Research & Development, LLC, in collaboration with Mitsubishi Tanabe Pharma Corporation. E.F. holds a research grant for this study from Janssen, has held research grants from Boehringer-Ingelheim, and has received consultancy or speaker fees from Sanofi, Boehringer Ingelheim, and Lilly & Co. F.T., W.S., N.R., and M.K.H. are full-time employees of Janssen Research & Development, LLC. G.A.F. reports receiving compensation from Janssen for serving on the Adjudication Panel of the CANVAS Program. B.N. holds a research grant for this study from Janssen, has held research grants for other large-scale cardiovascular outcome trials from Roche, Servier, and Merck Schering-Plough, and his institution has received consultancy, honoraria, or travel support for contributions he has made to advisory boards and/or the continuing medical education programs of Abbott, Janssen, Novartis, Pfizer, Roche, and Servier. K.W.M. has received research grants or contracts from AHA, Apple, Inc., Bayer, California Institute for Regenerative Medicine, Eidos, Ferring, Gilead, Google (Verily), Idorsia, Johnson & Johnson, Luitpold, PAC-12, Precordior, and Sanifit; has received consulting or other services from Amgen, Applied Therapeutics, AstraZeneca, Bayer, CSL Behring, Elsevier, Fibrogen, Inova, Johnson & Johnson, Lexicon, Myokardia, Novartis, Novo Nordisk, Otsuka, PhaseBio, Portola, Quidel, Sanofi and Theravance; and has equity in Precordior. V.P. has received fees for advisory boards, steering committee roles, or scientific presentations from AbbVie, Astellas, AstraZeneca, Bayer, Baxter, Bristol-Myers Squibb, Boehringer Ingelheim, Dimerix, Durect, Eli Lilly, Gilead, GlaxoSmithKline, Janssen, Merck, Mitsubishi Tanabe, Mundipharma, Novartis, Novo Nordisk, Pfizer, PharmaLink, Relypsa, Retrophin, Sanofi, Servier, Vifor, and Tricida. No other potential conflicts of interest relevant to this article were reported.
Author Contributions. E.F. contributed to the conceptualization, investigation, methodology, supervision, validation, writing (original draft and review and editing), and project administration. S.B., T.S., and V.T. contributed to the investigation, methodology, and writing (review and editing). F.T. contributed to the formal analysis, methodology, and writing (review and editing). W.S., N.R., and M.K.H. contributed to the investigation, writing (review and editing), funding acquisition, and project administration. G.A.F., B.N., K.W.M., and V.P. contributed to the investigation and writing (review and editing). E.F. is the guarantor of this work and, as such, had full access to all the data in the study and takes responsibility for the integrity of the data and the accuracy of the data analysis.