


To investigate the association of potential cardiovascular disease (CVD) biomarkers in patients with type 2 diabetes.
We enrolled 120 participants (aged 61.5–69.5 years) with type 2 diabetes and 60 (aged 62.5–73.5 years) with normal glucose tolerance in the discovery group from the original Da Qing Diabetes Study. Their diabetes status was confirmed in 1986; then, the participants were followed over 23 years to collect CVD outcome data. Untargeted and targeted metabolomics analyses based on ultra-high-performance liquid chromatography–tandem mass spectrometry were used to identify potential markers. Multivariable regression analysis was used to evaluate the association between metabolites and CVD outcomes. An independent group of 335 patients (aged 67.0–77.0 years) with diabetes was used for biomarker validation.
In the discovery group, untargeted metabolomics analysis found 16 lipids and fatty acids metabolites associated with CVD risk in patients with diabetes, with palmitoyl sphingomyelin (PSM) having the strongest association. Plasma PSM concentrations were significantly higher in cases of diabetes with CVD than without (41.68 ± 10.47 vs. 9.69 ± 1.47 μg/mL; P < 0.0001). The odds ratio (OR) of CVD for 1 µg/mL PSM change was 1.19 (95% CI 1.13–1.25) after adjustment of clinical confounders. The validation study confirmed that PSM was significantly associated with increased CVD risk in diabetes (OR 1.22 [95% CI 1.16–1.30]).
Changes in lipid and fatty acid content were significantly associated with CVD risk in the Chinese population with diabetes. PSM is a potential biomarker of increased CVD risk in diabetes.
Introduction
Metabolomics can be used to identify and quantify metabolic profile changes caused by exposure to toxins and drugs, environmental effects, or disease onset (1–3). Studies have reported that changes in circulating branched-chain and aromatic amino acids are associated with obesity, insulin resistance, and diabetes (4–6). In a large, prospective cohort study, phenylalanine, monounsaturated fatty acids, and polyunsaturated fatty acids were found to be associated with cardiovascular disease (CVD) (7). These data indicate that some metabolites affect diabetes and CVD pathogenesis beyond traditional risk factors. However, studies on potential markers of diabetes-related to CVD are lacking, except for a small cross-sectional study of 30 male patients with type 2 diabetes (8). To date, it remains unclear why some patients with diabetes develop CVD, while others do not, and the potential markers of diabetes-related CVD are not known. Hence, we aimed to discover metabolic biomarkers to identify individuals with a high risk of developing CVD among adults of Chinese ethnicity who had diabetes.
Research Design and Methods
Study Participants
Participants in the current study were selected from the original Da Qing Diabetes Study. In detail, in 1985, a diabetes survey was conducted among 110,660 residents of Da Qing, China (9,10); and 630 cases of type 2 diabetes, 576 of impaired glucose tolerance, and 519 of normal glucose tolerance (NGT) were diagnosed by standard 75-g oral glucose tolerance test. In 2009, a 23-year follow-up of this study was performed to estimate the CVD outcome rates. For the present metabolomics study, 120 out of the 630 participants with type 2 diabetes mellitus (DM) who were diagnosed in 1985 were selected. Of these individuals, half experienced CVD (DM_CVD group) over the 23-year follow-up period, and the other half did not (DM_non-CVD group). In addition, 60 individuals out of the original 519 people with NGT who had not experienced CVD over the 23-year follow-up period were selected as a normal control group (NGT_non-CVD group). Thus, 180 people were designated as the discovery group (Supplementary Fig. 1). CVD events were defined as fatal and nonfatal myocardial infarction and stroke, as confirmed by medical records (10). The blood pressure, BMI, 12-lead electrocardiogram, and serum lipids at baseline were measured for all participants during the 23-year follow-up. The participants of this study did not have other serious complications related to phospholipid metabolism, such as sepsis, neuropsychiatric disorders, and acute respiratory distress syndrome. All participants gave written informed consent. Institutional review boards at the World Health Organization and Fuwai Hospital approved this study.
We enrolled a second group for the validation data set, which consisted of 335 adults of Chinese ethnicity (mean age, 71.7 ± 6.7 years) who had type 2 diabetes from the local clinics of Da Qing. In this group, 123 patients had a diagnosis of CVD, and 212 patients did not have a diagnosis of CVD. Informed consent was obtained from the participants, and the research was approved by the Ethics Committee of Fuwai Hospital.
Plasma Sample Collection and Measurement
After overnight fast, blood samples of the 180 participants were obtained through venipuncture and collected in tubes containing EDTA. The samples were centrifuged within 30 min of collection at 1,200g for 10 min at 4°C, after which plasma was collected and stored at −80°C. Untargeted measurements were completed in 2018, and palmitoyl sphingomyelin (PSM) quantification measurements were performed in 2020.
Metabolomics Analysis
Metabolite Extraction
Plasma samples were thawed on ice before extraction. A mixture of methanol/acetonitrile (4:1, v/v, 800 µL) was added to the plasma (200 µL) and vortex-mixed for 30 s. After centrifugation at 12,000g for 20 min to precipitate the proteins at 4°C, the supernatant was collected, and an aliquot of 5 μL supernatant was used for ultra-high-performance liquid chromatography–tandem mass spectrometry (UPLC-MS/MS) analysis.
UPLC-MS/MS Analysis of Plasma Samples
UPLC-MS/MS analysis was performed on the Waters ACQUITY Ultra Performance LC System (Waters Corporation, Milford, MA) equipped with a BEH C18 column (100 mm × 2.1 mm, 1.7 μm). The mobile phase was composed of water (A) and acetonitrile (B), each containing 0.1% formic acid and 2 mmol/L ammonium formate. The following solvent gradient system was used: 0–2 min, 1.0% B–45% B; 2–10 min, 45% B–70% B; 10–13 min, 70% B–99% B; 13–22 min, 99% B; and 22–24 min, equilibration with 1.0% B. The flow rate was 0.45 mL/min. All samples were kept at 4°C during the analysis.
The Waters SYNAPT G2 HDMS (Waters Corp., Manchester, U.K.) was used to perform mass spectrometry with an electrospray ionization source operating in positive and negative ion modes. The capillary voltage was set at 3.0 kV and 2.5 kV in positive and negative modes, respectively; sample cone voltage was 40 V, and extraction cone voltage was 4 V. Using the drying gas nitrogen, the desolvation gas rate was set at 800 L/h at 450°C, the cone gas rate at 30 L/h, and the source temperature at 100°C. The scan time was set at 0.1 s and the interscan delay at 0.02 s; leucine enkephalin was used as the lock mass in both positive and negative ion modes. Data were collected in centroid mode from charge/mass ratio (m/z) 100–1,200 Da.
To ensure the stability of sequence analysis, a quality control (QC) sample was prepared by pooling the same volume (10 μL) from each prepared plasma sample from the three groups. Five pooled QC samples were run before analysis, and other QC samples were interspersed between every five participant’s samples during the anaytical run. Method validation and results (Supplementary Tables 1 and 2) are listed in the Supplementary Material.
Quantification of PSM
Quantification was performed through an external standard method through the construction of a calibration curve using a pure standard chromatographic reference compound. PSM (Y0852; CAS 6254-89-3; A.V.T. Pharmaceutical Co., Ltd.) was dissolved in methanol–acetonitrile (4:1, v/v) to prepare a 200 μg/mL stock solution. The calibration standards were prepared from this stock solution by diluting with methanol/acetonitrile (4:1, v/v) at 2.5, 5, 10, 20, 25, 40, 60, and 80 μg/mL. The equation of the calibration curve was y = 1817.2x − 4743.6; r2 = 0.9992; and it showed good linearity. The limit of detection and limit of quantitation were calculated based on the signal-to-noise ratio of 3:1 and 10:1, respectively. The linear range was 2.5–80 μg/mL; values for limit of detection and limit of quantitation were 1.0 and 2.5 μg/mL, respectively. After establishing the quantification method for PSM in plasma using UPLC-MS/MS, the plasma PSM concentrations were measured in the participants from the discovery and validation groups.
Data Analysis
Metabolomics Data Preprocess
Raw spectral data were first analyzed with MassLynx Applications Manager Version 4.1 (Waters Corp.). Deconvolution, alignment, and data reduction were performed to provide a list of retention times and mass pairs with peak areas corresponding to all detected peaks from each file in the data set. The main parameters are listed in the Supplementary Material.
Multivariate Statistical Analysis of Metabolomics Data
The UPLC-MS/MS data were transferred to the SIMCA-P software package (version 13.0; Umetric, Umeå, Sweden). Principal component analysis (PCA), which maps samples based on their spectral profile, was used to explore the inherent grouping between groups by visual inspection of score plots. Supervised models were subsequently constructed through orthogonal partial least squares discriminant analysis (OPLS-DA) to maximize the separation between classes and identify the biomarkers associated with the disease. Permutation cross-validation (N = 200) and the coefficient of variation-ANOVA test were first used to assess the reliability of all OPLS-DA models (Supplementary Fig. 2 and Supplementary Table 3). Then, results from the OPLS-DA were visualized as score plots. Potential biomarkers were selected based on variable importance for projection values and S-plots.
Statistical Analysis for Clinical Data and CVD Outcomes
The clinical characteristics between the groups (DM_CVD vs. NGT_non-CVD and DM_CVD vs. DM_non-CVD in both discovery and validation groups) were compared using the t test for continuous variables (the normality of data was checked using the Shapiro-Wilk test) and the χ2 test for categorical variables. Spearman correlation analysis was used to test correlations among different metabolites determined by untargeted measurements. The area under receiver operating characteristic curve with 95% CIs for CVD in relation to each metabolite was also computed using multivariate logistic regressions. The variance inflation factor test was used to diagnose multicollinearity among variables (11). In an exploratory analysis, after eliminating variables with severe multicollinearity, stepwise logistic regression controlling the influence of some traditional CVD risk factors (including age, sex, smoking, BMI, blood pressure, fasting plasma glucose [FPG], and total cholesterol [TC]) was used to find the metabolites most closely associated with CVD events. Furthermore, directed acyclic graphs (DAGs) (12,13) for estimating effects of PSM and sphingomyelin (SM) on the risk of CVD was developed for independent variable selection. The association between the quantitative PSM concentration and CVD risk was further tested in the discovery group as well as in the validation group.
Differences were considered statistically significant if two-sided P values were <0.05. Given the multiplicity of comparisons when assessing the association between different metabolites and CVD events after adjustment of CVD risk factors, the significance levels were adjusted using the Bonferroni method. A two-sided P value <0.003 was considered statistically significant (0.05/16). Data were managed and analyzed using SAS version 9.4 (SAS Institute, Inc., Cary, NC).
Results
Clinical Characteristics of Discovery and Validation Groups
Table 1 shows the clinical characteristics of the discovery and validation groups. Within the discovery group, systolic blood pressure (SBP), FPG, hemoglobin A1c (HbA1c), serum total triglycerides, TC, and LDL cholesterol (LDL-c) were higher in the DM_CVD group than in the NGT_non-CVD group; TC and LDL-c were also higher in the DM_CVD group than in the DM_non-CVD group (P < 0.05). In the validation cohort, the participants with CVD had significantly older ages, higher FPG, and higher HbA1c levels than those without CVD (P < 0.05).
Clinical characteristics of participants from the Da Qing Diabetes Study and the validation data set
| Discovery group | Validation group | ||||
|---|---|---|---|---|---|
| NGT_non-CVD group (N = 60) | DM_non-CVD group (N = 60) | DM_CVD group (N = 60) | DM_non-CVD group (N = 212) | DM_CVD group (n = 123) | |
| Age, years | 61.6 ± 9.0† | 65.5 ± 6.8 | 67.6 ± 7.0 | 71.7 ± 6.7 | 73.5 ± 6.4* |
| Male, N (%) | 36 (60.0) | 28 (46.7) | 33 (55.0) | 80 (36.2) | 55 (44.7) |
| Smoking, N (%) | 20 (33.3) | 17 (28.3) | 19 (31.7) | 61 (28.8) | 47 (38.2) |
| BMI, kg/m2 | 25.4 ± 3.5 | 25.0 ± 3.6 | 25.5 ± 3.2 | 25.4 ± 3.7 | 25.1 ± 3.5 |
| SBP, mmHg | 132.8 ± 16.6† | 150.7 ± 20.6 | 152.2 ± 24.8 | 148.6 ± 21.0 | 151.5 ± 22.8 |
| DBP, mmHg | 82.5 ± 9.5 | 78.3 ± 10.1 | 80.2 ± 10.5 | 75.5 ± 10.4 | 77.6 ± 10.0 |
| HbA1c, mmol/mol (%) | 43.2 ± 11.5 (6.2 ± 1.1)† | 63.9 ± 3.8 (8.0 ± 1.8) | 66.1 ± 6.0 (8.2 ± 1.6) | 62.4 ± 17.8 (7.9 ± 1.6) | 67.1 ± 18.3 (8.3 ± 1.7)* |
| FPG, mmol/L | 5.9 ± 1.4† | 8.7 ± 2.9 | 9.4 ± 3.7 | 7.4 ± 2.7 | 8.5 ± 3.3* |
| TG, mmol/L | 1.6 ± 1.0* | 1.8 ± 1.2 | 2.1 ± 1.5 | 2.0 ± 2.1 | 1.8 ± 1.5 |
| TC, mmol/L | 4.8 ± 0.8† | 4.9 ± 1.0* | 5.6 ± 1.5 | 4.9 ± 1.0 | 4.9 ± 1.3 |
| HDL-c, mmol/L | 1.3 ± 0.3 | 1.3 ± 0.4 | 1.3 ± 0.3 | 1.3 ± 0.4 | 1.3 ± 0.4 |
| LDL-c, mmol/L | 2.9 ± 0.7* | 2.8 ± 0.8* | 3.3 ± 1.2 | 3.0 ± 0.9 | 3.1 ± 1.1 |
Data are shown as mean ± SD unless otherwise indicated. P values are for the comparison between the DM_CVD and NGT_non-CVD groups and DM_CVD and DM_non-CVD groups.
DBP, diastolic blood pressure; HDL-c, HDL cholesterol; TG, triglyceride.
P < 0.05.
P < 0.001.
Almost all of the participants with diabetes took hypoglycemic drugs, such as metformin, sulfonylureas, and α-glucosidase inhibitors, but not glucagon-like peptide 1 receptor agonists or sodium–glucose cotransporter 2 inhibitors because the latter two drugs did not enter the Chinese market until 2009. About half of the patients took antihypertensive drugs, but fewer patients took lipid-lowering agents because such drugs were introduced to China very late and were not covered by the free medical system in China at that time (Supplementary Table 4).
Changes in Lipid and Fatty Acid Content Associated With CVD in the Discovery Group
Base peak intensity chromatograms of the plasma from all groups are shown in Supplementary Fig. 3A. The score plot of PCA revealed that the plasma metabolic profiles of the participants in the DM_CVD, DM_non-CVD, and NGT_non-CVD groups were clearly separated into three clusters (Fig. 1A). Among these clusters, the metabolic profiles of DM_CVD and NGT_non-CVD groups were clearly distinguishable along the direction of the coordinate axis t2, indicating that significant metabolic changes were related to both hyperglycemia and CVD. Furthermore, the metabolic profile of the DM_CVD group was clearly distinguishable from that of the DM_non-CVD group along the direction of the coordinate axis t1, indicating that significant metabolic changes were related to CVD in the group with diabetes.

Plasma metabolic profiles among patients with DM with and without CVD and the control group using PCA and each metabolite related with the risk of CVD in patients with diabetes. A: The score plots show a statistically significant difference in data between the DM and NGT groups, indicating significant biochemical changes caused by hyperglycemia. Furthermore, there was a clear separation between DM_CVD and DM_non-CVD, indicating that metabolites can differentiate diabetes with and without CVD. B: Association between each metabolite and CVD in diabetes after adjustment for age, sex, smoking, BMI, SBP, FPG, and TC. PC, glycerophosphocholine. ‡Per 0.01-unit increase; §per 0.1-unit increase; ǁper 10-unit increase.
Plasma metabolic profiles among patients with DM with and without CVD and the control group using PCA and each metabolite related with the risk of CVD in patients with diabetes. A: The score plots show a statistically significant difference in data between the DM and NGT groups, indicating significant biochemical changes caused by hyperglycemia. Furthermore, there was a clear separation between DM_CVD and DM_non-CVD, indicating that metabolites can differentiate diabetes with and without CVD. B: Association between each metabolite and CVD in diabetes after adjustment for age, sex, smoking, BMI, SBP, FPG, and TC. PC, glycerophosphocholine. ‡Per 0.01-unit increase; §per 0.1-unit increase; ǁper 10-unit increase.
Supervised modeling was subsequently carried out using OPLS-DA to maximize the separation between different classes and identify the biomarkers associated with CVD events. The results of the permutation cross-validation (Supplementary Fig. 2) and coefficient of variation-ANOVA test (P < 0.0001) (Supplementary Table 3) showed that the original OPLS-DA models were statistically acceptable. As shown in Supplementary Fig. 3B and C, the plasma metabolic profiles of DM_CVD and NGT-non-CVD groups and those of DM_non-CVD and NGT_non-CVD groups were clearly separated through OPLS-DA. Variables with variable importance for projection >1, intensity threshold (count) in plasma (>1,000), and bigger fold-changes (>5) between the DM_CVD and NGT_non-CVD groups were used as selection criteria for differential metabolites. A total of 16 metabolites were identified as potential biomarkers for hyperglycemia-induced CVD (Table 2). Supplementary Figure 4 shows the normalized peak intensities of the 16 metabolites, and the difference in their respective peak intensities among the DM_CVD, DM_non-CVD, and NGT_non-CVD groups.
Sixteen characteristic metabolites associated with the pathogenesis of type 2 diabetes and CVD
| Metabolites | Retention time (min) | Adduct m/z | Adduct ion | Change in trend |
|---|---|---|---|---|
| Dihydroxyacetone phosphate | 0.52 | 214.9183 | [M+2Na-H]+ | ↑ |
| Unidentified metabolite 1 | 0.52 | 458.8547 | — | ↑ |
| Taurocyamine | 1.18 | 168.0597 | [M+H]+ | ↓ |
| Lactosylceramide (d18:1/12:0) | 14.38 | 807.5691 | [M+H]+ | ↑ |
| PC (18:1/18:1) | 14.61 | 830.5654 | [M+2Na-H]+ | ↑ |
| PSM | 14.91 | 704.5742 | [M+H]+ | ↑ |
| PC (20:0/18:2) | 15.88 | 836.6159 | [M+Na]+ | ↑ |
| Diacylglycerol (22:1n9/0:0/22:6n3) | 16.28 | 786.6003 | [M+ACN+Na]+ | ↑ |
| Unidentified metabolite 2 | 16.64 | 812.6166 | — | ↑ |
| PC (24:1/14:0) | 16.87 | 838.6313 | [M+Na]+ | ↑ |
| Glucosylceramide (d18:1/18:0) | 16.95 | 811.6683 | [M+IsoProp+Na+H]+ | ↑ |
| Unidentified metabolite 3 | 17.67 | 788.6167 | — | ↑ |
| Diacylglycerol (18:4/24:1/0:0) | 17.68 | 762.6001 | [M+ACN+Na]+ | ↑ |
| SM (d18:1/24:1) | 18.82 | 814.684 | [M+H]+ | ↑ |
| 1-stearoylglycerophosphoinositol | 7.66 | 599.3193 | [M-H]− | ↑ |
| Stearoylcarnitine | 10.45 | 464.3140 | [M+K-2H]− | ↑ |
Change trend is from the DM_CVD group compared with the NGT_non-CVD group.
PC, glycerophosphocholine.
The metabolites were identified by their molecular weights and MS spectra through databases, including the Human Metabolome Database (https://www.hmdb.ca/), METLIN (https://metlin.scripps.edu/), and LIPID MAPS-Nature Lipidomics Gateway (https://www.lipidmaps.org/). Of the 16 characterized metabolites, 13 were identified. They were dihydroxyacetone phosphate, taurocyamine, lactosylceramide (d18:1/12:0), three glycerophosphocholines (18:1/18:1, 20:0/18:2, and 24:1/14:0), PSM, two diacylglycerols (22:1n9/0:0/22:6n3 and 18:4/24:1/0:0), glucosylceramide (d18:1/18:0), SM (d18:1/24:1), 1-stearoylglycerophosphoinositol, stearoylcarnitine, and unidentified metabolites 1–3 with the retention time_m/z being 0.52_458.8547, 16.64_812.6166, and 17.67_788.6167, respectively (Table 2). Among them, PSM was further confirmed by comparison of retention time and mass spectra with the standard (Supplementary Fig. 5).
Supplementary Table 5 and Fig. 1B show the odds ratio (OR) for CVD risk in patients with diabetes associated with each metabolite. Of the 16 metabolites, 15 were significantly positively associated with CVD; only taurocyamine was negatively associated with CVD. All metabolites could predict diabetic CVD with an area under receiver operating characteristic curve >0.6 (P < 0.05 for all) (Supplementary Fig. 6). Heat map analysis revealed that all 16 metabolites were correlated with each other (P < 0.001) (Supplementary Fig. 7). The variance inflation factor test was performed to eliminate the effect of multicollinearity among 16 metabolites. The stepwise regression analyses showed that only PSM (OR 1.81 [95% CI 1.29–2.53]; P = 0.0006) and unidentified metabolite 2 (OR 1.24 [95% CI 1.12–1.37]; P < 0.0001) were significantly associated with diabetic CVD after controlling for age, sex, smoking, SBP, TC, and FPG (Supplementary Table 6). Based on these results, we decided to confirm the association between quantitative PSM and CVD event in the discovery group and the independent validation group with the adjustment of confounders selected by DAG.
According to DAGs (Supplementary Fig. 8), age, sex, smoking, BMI, SBP, TC, and FPG were selected as confounders. Diacylglycerols are identified as a mediator on the causal path from PSM to CVD and also a collider. Exclusion of this collider will close backdoor effect from 1-stearoylglycerophosphoinositol. Other metabolites were also not being identified as confounders. Therefore, they were excluded in the analysis. Controlling these confounders in logistic regression was assumed to block the backdoor path.
Quantification of PSM and its Association With CVD in the Discovery Group
Quantification analysis showed that the concentration of PSM was higher in the DM_CVD group than in the DM_non-CVD group (41.68 ± 10.47 vs. 9.69 ± 1.47 μg/mL; P < 0.0001) in the discovery group. As per partial correlation analysis, PSM level was positively associated with CVD (r = 0.9007; P < 0.0001) and inversely correlated with CVD-free years (r = −0.8229; P < 0.0001; data not shown). Multivariate regression analysis revealed that the concentration of PSM (1 µg/mL change) was associated with CVD events (OR 1.19 [95% CI 1.13–1.25]; P < 0.0001) (Fig. 2B) after adjustment of age, sex, smoking, BMI, SBP, FPG, and TC. The results did not change (OR 1.17 [95% CI 1.11–1.23]; P < 0.0001) after further adjustment of hypoglycemic, antihypertensive, and lipid-lowering medications used in the participants.
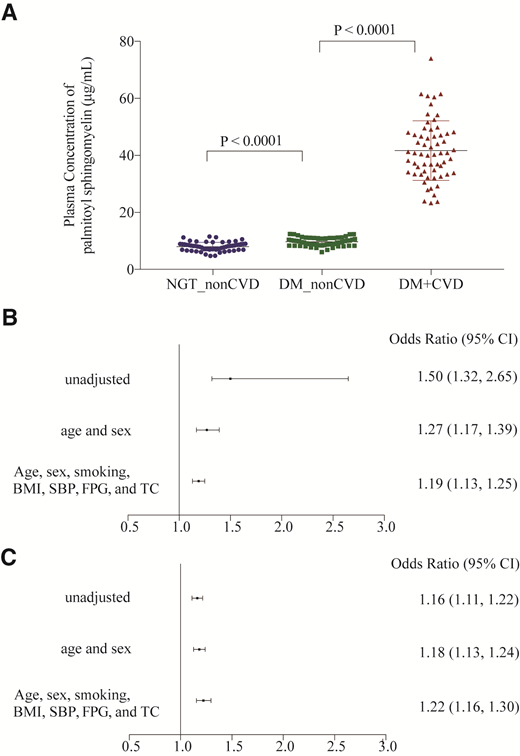
Plasma concentration level of PSM in participants and the association with CVD events in the discovery and validation groups of diabetes. A: Plasma concentration level of PSM of participants in the NGT_non-CVD, DM_non-CVD, and DM_CVD groups. B: Association between plasma concentration of PSM and CVD in patients with diabetes unadjusted and adjusted for conventional cardiovascular risk factors in the discovery group. C: Association between plasma concentration of PSM and CVD in patients with diabetes unadjusted and adjusted for conventional cardiovascular risk factors in the validation data set.
Plasma concentration level of PSM in participants and the association with CVD events in the discovery and validation groups of diabetes. A: Plasma concentration level of PSM of participants in the NGT_non-CVD, DM_non-CVD, and DM_CVD groups. B: Association between plasma concentration of PSM and CVD in patients with diabetes unadjusted and adjusted for conventional cardiovascular risk factors in the discovery group. C: Association between plasma concentration of PSM and CVD in patients with diabetes unadjusted and adjusted for conventional cardiovascular risk factors in the validation data set.
Quantification of PSM and its Association With CVD in the Validation Group
The same quantification method as that used for PSM in the discovery group was used to detect its plasma level in an independent group. In the diabetes validation data set, the plasma level of PSM was higher in participants with CVD than in those without CVD (13.1 ± 6.2 vs. 8.2 ± 5.1 µg/mL; P < 0.001). Logistic regression analyses revealed that the 1 µg/mL increase of PSM concentration was associated with CVD risk (OR 1.22 [95% CI 1.16–1.30]; P < 0.0001) after adjusting for age, sex, smoking, BMI, SBP, FPG, and TC (Fig. 2C). Furthermore, the 1-SD increase of PSM was associated with a higher risk of CVD (OR 2.90 [95% CI 2.11–3.98]) (Supplementary Table 7). Of interest, the OR of CVD risk for the 1-SD (6.7 years) increase in age was 1.29 (95% CI 0.96–1.73) and for the 1-SD (3.0 mmol/L) increase in FPG was 1.44 (95% CI 1.10–1.89).
Conclusions
Type 2 diabetes is a major cause of increased morbidity and mortality in CVD. According to data from a 2013 survey, the overall prevalence of diabetes in adults of Chinese ethnicity was 10.9% and that of prediabetes was 35.7% (14). The China Da Qing Diabetes Study was a longitudinal study that investigated CVD events and death rates in patients newly diagnosed with type 2 diabetes in 1986 and who were followed up for 23 years (9,15). Results from the follow-up study revealed that patients with diabetes had increased all-cause mortality compared with control subjects with normal glucose, and the mortality rate due to CVD was 48.5% (10). However, the mechanism of hyperglycemia-induced CVD remains unclear. Therefore, identifying individuals with type 2 diabetes who are at high risk of CVD is a challenge.
The current study found that the plasma metabolic profiles were significantly different between the participants with and without diabetes and were also different between the subjects with diabetes with and without CVD. There were 16 metabolites significantly correlated with an increased risk of CVD in the group with diabetes. Notably, the stepwise logistic analysis revealed that PSM and an unidentified metabolite 2 in literature were significantly correlated with the increased risk of CVD in people with diabetes, whereas other metabolites not highly correlated to PSM were not associated with the CVD risk after accounting for the influence of other traditional CVD risk factors. We also tried to confirm the association between the PSM and CVD by using DAGs selected confounders. The results from the quantification analysis were consistent with those of untargeted analysis in the discovery group. More importantly, this correlation was further confirmed by the analysis in the validation data set. This indicates that the PSM level is strongly associated with an increased risk of CVD in the population with diabetes and may be useful to identify diabetes people with high risk of CVD.
The association between SM and chronic diseases has been reported in the literature (16–19), but PSM has rarely been reported. Inhibition of de novo synthesis of SM in mice markedly increased insulin sensitivity (16–18). SMs are altered not only in individuals with type 2 diabetes, but also in individuals with prediabetes (19). Human plasma SM levels are positively and independently related to coronary artery disease in the general population (20). Higher median SM levels are associated with a higher risk of coronary heart disease and lower left ventricular ejection fraction (21).
PSM is a metabolite of SM containing palmitate (16:0) at the variable acylation position, but this form of SM is rarely involved in the risk of CVD in the literature. In the current study, both SMs and PSM were significantly associated with CVD risk in diabetes in a univariate correlation analysis. However, a stepwise analysis to determine the association between these metabolites and CVD risk in the group with diabetes showed that PSM was significantly associated with the CVD risk, whereas the SMs did not enter the model at a P < 0.05 level. Furthermore, to evaluate the contribution of individual potential risk factors on the risk of CVD, we analyzed the association between the 1-SD increase in independent variables and CVD risk in the validation population. Surprisingly, our data showed that a 1-SD increase in PSM was associated with a much higher risk of CVD in the group with diabetes compared with a 1-SD (equal to 3.0 mmol/L) increase in FPG (PSM vs. FPG: OR 2.90 vs. 1.44). These results suggested that PSM was strongly associated with CVD risk in people with diabetes. Thus, PSM could be a potentially useful and easily detectable biomarker of CVD risk in the population with diabetes.
Our study has several strengths. First, participants were accurately classified as having DM or NGT with oral glucose tolerance test screening, and all had no previous CVD history at baseline. Second, the 23-year follow-up allowed time for CVD events to develop. Third, this is the first population-based longitudinal study to examine CVD-related metabolites in adults of Chinese ethnicity who had diabetes. The association between PSM and CVD risk was found by using untargeted metabolomics analysis and confirmed using a quantification method in the discovery group and an independent validation group. Fourth, fasting plasma samples were used for metabolomics analysis, which avoided the interference of food intake on the results. This study also has some limitations. Baseline metabolic profiles from 1986 were not available because plasma samples were not stored for >20 years. Thus, we were unable to investigate changes in metabolites over the 23-year follow-up period. We also did not collect the information regarding metabolic dysfunction–associated fatty liver disease in the participants, which could impact the metabolite levels. Furthermore, the sample size was relatively small. Only 180 participants in the discovery group and 335 participants in the validation group could be subjected to the metabolomics analysis. Moreover, three metabolites associated with the increased risk of CVD were unidentified in the literature.
In conclusion, changes in 16 lipids and fatty acid metabolites were significantly associated with CVD in adults of Chinese ethnicity who had diabetes, with PSM being the most strongly associated independent factor. These results suggest that PSM is a potentially useful biomarker of increased risk of CVD in patients with diabetes.
Y.C. and H.J. contributed equally to this work.
This article contains supplementary material online at https://doi.org/10.2337/figshare.17137037.
Article Information
Acknowledgments. We thank Prof. Chenggang Jin, Beijing Normal University, for providing valuable statistic advice.
Funding. This study was funded by the Chinese Academy of Medical Sciences, Novo Nordisk Union Diabetes Research Talent Fund. This work was part of the China Da Qing Diabetes Study Follow-Up Study, which was supported by a Centers for Disease Control and Prevention/World Health Organization Cooperative Agreement (U58/CCU424123-01-02), the China-Japan Friendship Hospital, Da Qing First Hospital, and the Chinese Academy of Medical Sciences Innovation Fund for Medical Sciences (2020-I2M-2-006).
Duality of Interest. No potential conflicts of interest relevant to this article were reported.
Author Contributions. Y.C., Z.Z., and G.L. conceived and designed the study. H.J. and M.Y. performed UPLC-MS/MS and data processing. X.Q. analyzed the data and wrote the first draft of the manuscript. J.W., Q.G., Y.A., and H.L. performed the follow-up study in 2009. M.Y. and N.S. prepared the samples of this study. Y.C., H.J., X.Q., S.L., and G.L. performed statistical analysis and provided data. All coauthors commented on the manuscript and agreed with the manuscript results and conclusions. Z.Z. and G.L. are the guarantors of this work and, as such, had full access to all of the data in the study and take responsibility for the integrity of the data and the accuracy of the data analysis.
Prior Presentation. Parts of this study were presented in oral poster form at the 53rd Annual Meeting of the European Association for the Study of Diabetes, Lisbon, Portugal, 11–15 September 2017.