


To assess the relationship of circulating fatty acids (FA) with risk of type 2 diabetes (T2D) and potential interactions with genetic risk.
A total of 95,854 participants with complete data on plasma FA from the UK Biobank were enrolled between 2006 and 2010 and were followed up to the end of 2020. Plasma concentrations of saturated fatty acids (SFA), monounsaturated fatty acids (MUFA), and polyunsaturated fatty acids (PUFA) were analyzed by a high-throughput nuclear magnetic resonance–based biomarker profiling platform. The genetic risk scores (GRS) were calculated on the basis of 424 variants associated with T2D. Pathway-specific GRS were calculated based on robust clusters of T2D loci.
There were 3,052 instances of T2D documented after an average follow-up of 11.6 years. Plasma concentrations of SFA and MUFA were positively associated with T2D risk, while plasma PUFA were inversely associated. After adjustment for major risk factors, hazard ratios (95% CI) of T2D for 1-SD increment were 1.03 (1.02–1.04) for SFA, 1.03 (1.02–1.05) for MUFA, 0.62 (0.56–0.68) for PUFA, 0.67 (0.61–0.73) for n-6 PUFA, 0.90 (0.85–0.95) for n-3 PUFA, and 1.01 (0.98–1.04) for n-6–to–n-3 ratio. Plasma MUFA had significant interactions with the overall GRS and GRS for proinsulin and liver/lipid clusters on T2D risk. The protective associations of n-3 PUFA with T2D risk were weaker among individuals with higher obesity GRS (P interaction = 0.040) and liver/lipid GRS (P interaction = 0.012). Additionally, increased plasma n-3 PUFA concentration was associated with more reductions in T2D risk among participants carrying more docosapentaenoic acid–associated alleles (P interaction = 0.007).
Plasma concentrations of SFA and MUFA were associated with a higher T2D risk, whereas plasma PUFA and n-6 and n-3 PUFA were related to a lower risk. Circulating MUFA and n-3 PUFA had significant interactions with genetic predisposition to T2D and FA-associated variants.
Introduction
The prevalence of type 2 diabetes (T2D) is steadily increasing, affecting 463 million people worldwide and costing 10% of global health expenditure (1). Evidence has suggested that T2D results from the complex interplay between genetic and environmental factors, including dietary factors (2). The quality of dietary fat thus plays a critical role in the development of T2D (3). Prevailing dietary guidelines emphasize replacing saturated fatty acids (SFA) with monounsaturated fatty acids (MUFA) and polyunsaturated fatty acids (PUFA) (4). However, evidence regarding specific dietary fatty acids (FA) in relation to T2D development is inconsistent (5,6). The latest meta-analysis summarizing 23 observational studies concluded no or weak linear associations of dietary SFA, MUFA, and PUFA with T2D incidence, and the certainty of evidence was from very low to moderate (5). In contrast to the error-prone assessment of FA intakes via self-report, circulating biomarkers of FA are considered more reliable (7). However, evidence on the associations of circulating FA with T2D risk is lacking and inconclusive (8–11).
One important explanation for the high heterogeneity between previous studies is thought to be gene polymorphisms and gene-nutrient interaction. The response to dietary FA may vary depending on an individual’s genetic makeup, and thus, elucidating the gene-nutrient interactions could help the implementation of precision nutrition, which enables personalized dietary guidance for more effective prevention of T2D. However, although some studies indicated promising interactions of specific FA with certain gene variants, none of the published interactions have been replicated (12). Recent advances in gene-sequencing technologies have offered great opportunities as well as challenges in the use of precision nutrition for T2D prevention. Owing to the success of large-scale genome-wide association studies (GWAS) of T2D in the past few years, >500 genomic loci have been identified to be associated with T2D (13). By aggregating these T2D-associated single nucleotide polymorphisms (SNP) into genetic risk scores (GRS), the overall genetic risk of T2D can be continuously measured and well predicted (14). Therefore, forming GRS is useful to assess interactions between nutrients and overall genetic predisposition to T2D. In addition, a recent soft clustering analysis of T2D-associated loci has successfully established five robust clusters representing likely disease-causing pathways, including β-cell, proinsulin, obesity, lipodystrophy, and liver/lipid clusters, which further deconstruct T2D heterogeneity (15). Forming these pathway-specific cluster GRS enables the analysis of interactions between nutrients and mechanistic pathways for T2D. Unfortunately, a recent meta-analysis of 102,350 individuals failed to observe any significant interactions of dietary SFA, MUFA, PUFA, n-6 PUFA, and n-3 PUFA intake with genetic risk of T2D (16). Therefore, large cohort studies using objective biomarkers and investigations on potential interactions with pathway-specific genetic risk for T2D are needed to support the additional benefits of precision nutrition beyond traditional dietary approaches.
Circulating FA concentrations depend on not only dietary intakes but also on endogenous synthesis and metabolism (7). Meta-analyses of GWAS have identified 16 SNP associated with plasma levels of specific FA (17–19). However, little is known about whether these variants could modify the effects of specific FA on T2D development (11).
To fill these knowledge gaps, we first assessed the associations of specific plasma FA with T2D risk in 95,854 adults from the UK Biobank study (Supplementary Fig. 1). Then we evaluated the interactions between specific plasma FA and the genetic predisposition to T2D, captured by the GRS and pathway-specific GRS, on risk of T2D. The modification effect of FA-associated variants on the associations of circulating FA levels with T2D was also explored.
Research Design and Methods
Study Setting and Participants
Detailed information on the UK Biobank has been reported previously (20). Briefly, more than half a million participants aged 37–73 years were recruited at 22 assessment centers across the U.K. from 2006 to 2010. Participants provided a wide range of information through a series of baseline questionnaires, biological samples, and various physical assessments. The UK Biobank study was approved by the North West Multi-Centre Research Ethics Committee (Manchester, U.K.). Written informed consent was obtained from all of the participants.
This project included 117,876 participants with available data on plasma FA levels at baseline in the UK Biobank. After patients with cardiovascular disease, cancer, or diabetes at baseline were excluded, 95,854 individuals were selected for the analysis of the relationships between plasma FA and incident T2D. To further investigate potential interactions between plasma FA and GRS, we excluded participants with no genetic data and who were not of White British descent, resulting in a total of 89,955 individuals for gene-FA interaction analysis (Supplementary Fig. 2).
Genotype Data and GRS Calculation
The genotyping process, imputation, and quality control of the genetic data in the UK Biobank study have been described in detail (21). We created an overall GRS for T2D using 424 selected SNP (Supplementary Table 1) that passed quality control and were associated with T2D based on the largest genome-wide multiethnic meta-analysis (13). The GRS were calculated by a widely used weighting method (22) using the following equation: GRS = (β1 × SNP1 + β2 × SNP2 +…+ β424 × SNP424) × (424/sum of the β coefficients), in which SNPi is the number of risk allele of each SNP. β-Coefficients were derived from the European population in the latest genome-wide multiethnic meta-analysis (13) to obtain more precise effect sizes of these SNP on T2D. The calculated GRS ranged from 358.4 to 465.2, with a higher GRS indicating a higher genetic predisposition to T2D. To further explore whether mechanistic pathways driven by established T2D genetic loci had interactions with plasma FA, we generated five pathway-specific GRS based on a recent soft clustering analysis of T2D-associated loci, which successfully established five robust clusters representing likely disease-causing pathways, including β-cell, proinsulin, obesity, lipodystrophy, and liver/lipid clusters (15). SNP included in each cluster are shown in Supplementary Table 2. Cluster GRS for each cluster were generated by summing the number of alleles multiplied by its cluster weight (15). We also selected SNP that were identified to be associated with individual circulating FA levels at genome-wide significance (17–19) (Supplementary Table 3).
Assessment of Plasma FA and Covariates
Among the blood samples collected at baseline, ∼120,000 EDTA plasma samples were randomly selected, and plasma concentrations of FA were determined using a high-throughput nuclear magnetic resonance–based metabolic biomarker profiling platform, which was developed by Nightingale Health Ltd and is known for absence of batch effects and high repeatability over time. The detailed information on biomarker measurements and quality control is available at https://biobank.ctsu.ox.ac.uk/crystal/label.cgi?id=220. In the repeated assessment visit (2012–2013), 5,000 blood samples were collected and measured. The concentrations of plasma FA measured at the repeat assessment were moderately correlated with those measured at baseline (r ranged from 0.5 to 0.6), indicating the biological stability of the biomarker measures over time.
Dietary data were collected via a touch screen short food frequency questionnaire. We created a diet quality score according to the recent definition of ideal consumption of dietary components for cardiometabolic diseases (Supplementary Table 4) (23). The diet quality score ranged from 0 to 100, with a higher score indicating a healthier diet. Information on potential confounders was also assessed, including age, sex, ethnicity, weight and height, average household income, education, Townsend deprivation index, physical activity, smoking, alcohol consumption, medical history, drug use, and dietary supplements. The MET was calculated based on the International Physical Activity Questionnaire short form. Details of these assessments are available from https://www.ukbiobank.ac.uk.
T2D Ascertainment
T2D status was identified using the UK Biobank algorithms for the diagnosis of diabetes (Supplementary Table 5), which has been validated in a subset of the participants with 96% accuracy. Individuals with T2D were ascertained using cumulative hospital inpatient records containing data on admissions and diagnoses from the Hospital Episode Statistics, which were available for participants until 31 December 2020. Follow-up time was calculated from the recruitment date to the time of the first T2D diagnosis, death, lost to follow-up, or the end of follow-up (31 December 2020), whichever came first.
Statistical Analysis
Associations of Specific Plasma FA With T2D Risk
Specific plasma FA levels are expressed as percentages of plasma total FA, which are more meaningful than absolute concentrations in terms of metabolic relationships (7). Multivariable Cox regression analyses were applied to calculate hazard ratios (HR) and 95% CI for T2D according to quartiles or 1-SD increment of plasma FA. Proportional hazards assumption was checked using Schoenfeld residuals. Covariates according to previous literature (8,10,11) and biological plausibility were considered in our analyses. Model 1 was adjusted for age and sex. Model 2 was additionally adjusted for assessment centers, race, BMI, Townsend deprivation index, education, annual household income, physical activity, smoking, alcohol drinking, history of hypertension, history of hypercholesteremia, family history of diabetes, and use of mineral supplements, vitamin supplements, and aspirin. Model 3 was further adjusted for remaining plasma FA (SFA, MUFA, PUFA, n-6 PUFA, and n-3 PUFA) where appropriate. Missing data were coded as a missing indicator category (Supplementary Table 6), if necessary. We also performed the restricted cubic spline regression to evaluate the dose-response relationship between specific plasma FA and T2D risk.
Interactions of Plasma FA With GRS and FA-Associated Alleles
We tested the potential interaction between specific plasma FA and GRS/cluster GRS on the incident T2D using multivariable Cox proportional hazards models including a multiplicative interaction term. In these analyses, family history of diabetes was not included in models to avoid overadjustment, and continuous standardized values ([value − mean]/SD) of specific plasma FA (percentage of total FA for value, mean, and SD) and GRS were used for appropriate scaling for clinical interpretation. For GRS with significant interactions, we also evaluated whether the associations of plasma FA with T2D varied across categories of GRS to assess the modification effect. Potential interactions of plasma FA with the number of FA-associated alleles or individual SNP were also evaluated by including a multiplicative interaction term in models.
Subgroup and Sensitivity Analyses
We performed subgroup analyses stratified by baseline characteristics to test the potential modification effect of covariates on the associations of plasma FA with T2D. The following sensitivity analyses were conducted: we tested whether documented relationships were influenced by further adjustment for lipid-lowering medications, glucosamine use, sleep pattern (poor, intermediate, or healthy) (24), hormone replacement therapy and oral contraceptive use, history of nonalcoholic fatty liver disease (NAFLD), or a diet quality score. To minimize the possibility of reverse causation, we further excluded individuals with incident T2D that occurred within the first 2 years. Because there might be potential undiagnosed diabetes at baseline, we excluded participants with baseline HbA1c level ≥48 mmol/mol or glucose level ≥11.1 mmol/L. We also excluded participants with extreme BMI (<18.5 or >40 kg/m2) to see whether the results changed. Finally, analyses were repeated after restricting the cohort to individuals with no missing covariate data.
No adjustment for multiple testing was used because all statistical tests were based on a priori hypotheses. A two-tailed P < 0.05 was considered to be statistically significant. Statistical analyses were performed with SAS 9.4 software (SAS Institute, Cary, NC).
Results
Population Characteristics
Table 1 summarizes the participants' characteristics in the current UK Biobank by quartiles of plasma FA at baseline. Individuals with higher concentrations of SFA and MUFA tended to be White, have a higher BMI, be current smokers, have prevalent hypertension and NAFLD, and have a lower diet quality. They were less likely to be educated and use vitamins and minerals. Participants with higher concentrations of PUFA were younger, more often female and non-White, wealthier, and more educated, and had a lower BMI. They were also prone to exercise, use vitamins and minerals, and have a higher diet quality, but were less likely to smoke, drink alcohol, have prevalent hypertension, NAFLD, and hypercholesteremia, and use aspirin. Plasma SFA concentrations were weakly correlated with plasma MUFA (r = 0.26; P < 0.001) (Supplementary Table 7), whereas plasma PUFA concentrations were negatively correlated with plasma SFA (r = −0.69; P < 0.001) and MUFA (r = −0.86; P < 0.001).
Baseline characteristics of participants by quartiles of FAs in the UK Biobank cohort
| Quartile of plasma SFA | Quartile of plasma MUFA | Quartile of plasma PUFA | ||||||||||
|---|---|---|---|---|---|---|---|---|---|---|---|---|
| Q1 | Q2 | Q3 | Q4 | Q1 | Q2 | Q3 | Q4 | Q1 | Q2 | Q3 | Q4 | |
| Characteristic | n = 23,963 | n = 23,964 | n = 23,964 | n = 23,963 | n = 23,963 | n = 23,964 | n = 23,964 | n = 23,963 | n = 23,963 | n = 23,964 | n = 23,964 | n = 23,963 |
| Range (% of total FA) | ≤32.7 | 32.7–33.9 | 33.9–35.1 | ≥35.1 | ≤21.5 | 21.5–23.1 | 23.1–25.0 | ≥25.0 | ≤40.5 | 40.5–43.1 | 43.1–45.2 | ≥45.2 |
| Age (years) | 54.8 (8.2) | 55.5 (8.1) | 56.1 (8.0) | 56.5 (7.9) | 54.9 (8.2) | 55.7 (8.1) | 56.3 (8.0) | 56.0 (8.0) | 56.3 (7.9) | 56.4 (8.0) | 55.6 (8.1) | 54.6 (8.2) |
| Male | 45.9 | 40.1 | 40.8 | 51.2 | 30.3 | 38.6 | 47.2 | 61.8 | 60.5 | 45.0 | 37.3 | 35.1 |
| White ethnicity | 89.1 | 95.0 | 96.5 | 97.3 | 91.7 | 94.3 | 95.2 | 96.7 | 97.3 | 96.2 | 95.2 | 89.2 |
| BMI (kg/m2) | 26.4 (4.3) | 26.8 (4.5) | 27.2 (4.6) | 28.2 (4.7) | 24.9 (3.7) | 26.4 (4.2) | 27.8 (4.5) | 29.4 (4.7) | 29.3 (4.7) | 27.7 (4.5) | 26.4 (4.2) | 25.1 (3.8) |
| Education | ||||||||||||
| College or university degree | 37.7 | 33.1 | 32.3 | 30.7 | 41.3 | 34.9 | 31.0 | 26.7 | 27.0 | 30.6 | 34.7 | 41.5 |
| Vocational qualifications | 10.8 | 11.3 | 11.5 | 12.4 | 9.8 | 10.8 | 11.9 | 13.6 | 13.6 | 11.7 | 10.7 | 10.0 |
| Optional national exams at ages 17–18 years | 11.1 | 11.6 | 11.2 | 11.1 | 12.6 | 11.4 | 10.7 | 10.2 | 10.3 | 10.9 | 11.9 | 11.9 |
| National exams at age 16 years | 25.4 | 27.8 | 28.1 | 27.5 | 24.7 | 27.4 | 27.9 | 28.6 | 28.5 | 28.3 | 27.3 | 24.6 |
| Others | 13.8 | 15.0 | 15.9 | 17.2 | 10.7 | 14.4 | 17.2 | 19.6 | 19.4 | 17.4 | 14.3 | 10.9 |
| Townsend deprivation index | −1.2 (3.2) | −1.5 (3.0) | −1.5 (3.0) | −1.4 (3.0) | −1.5 (3.0) | −1.5 (3.0) | −1.4 (3.0) | −1.1 (3.2) | −1.2 (3.1) | −1.4 (3.0) | −1.5 (3.0) | −1.4 (3.1) |
| Household income (£) | ||||||||||||
| <18,000† | 17.8 | 16.9 | 17.5 | 18.8 | 13.6 | 17.0 | 19.1 | 21.3 | 20.8 | 18.9 | 16.8 | 14.6 |
| 18,000–30,999 | 20.9 | 21.5 | 21.4 | 22.3 | 19.9 | 21.3 | 22.4 | 22.4 | 22.7 | 22.0 | 21.3 | 20.1 |
| 31,000–51,999 | 23.0 | 23.3 | 22.9 | 23.0 | 23.5 | 23.3 | 22.7 | 22.8 | 22.8 | 22.9 | 23.4 | 23.2 |
| 52,000–100,000 | 19.0 | 18.8 | 18.8 | 18.0 | 21.7 | 19.0 | 17.3 | 16.6 | 16.9 | 17.5 | 19.1 | 21.3 |
| >100,000 | 5.0 | 5.2 | 5.1 | 4.7 | 7.5 | 5.1 | 4.2 | 3.3 | 3.5 | 4.3 | 5.5 | 6.8 |
| Smoking status | ||||||||||||
| Never | 61.4 | 58.5 | 55.6 | 48.5 | 62.4 | 58.4 | 55.5 | 47.7 | 47.3 | 53.6 | 58.8 | 64.4 |
| Previous | 29.8 | 32.0 | 33.5 | 37.1 | 31.2 | 32.2 | 33.3 | 35.7 | 36.4 | 34.3 | 31.9 | 29.8 |
| Current | 8.3 | 9.1 | 10.5 | 13.9 | 6.0 | 9.0 | 10.7 | 16.1 | 15.8 | 11.7 | 8.9 | 5.4 |
| Alcohol consumption | ||||||||||||
| Never or special occasions only | 25.2 | 17.9 | 15.3 | 13.8 | 15.8 | 17.9 | 19.1 | 19.4 | 17.2 | 17.2 | 17.0 | 20.7 |
| 1–3 times/month | 14.0 | 12.0 | 10.3 | 8.7 | 10.1 | 11.3 | 11.6 | 12.0 | 10.8 | 10.9 | 11.2 | 12.1 |
| 1 or 2 times/week | 28.3 | 28.2 | 25.5 | 22.4 | 24.9 | 26.5 | 27.0 | 26.0 | 24.7 | 26.0 | 27.1 | 26.5 |
| 3 or 4 times/week | 20.6 | 24.6 | 25.6 | 25.0 | 26.5 | 24.2 | 23.0 | 22.3 | 23.2 | 23.7 | 24.7 | 24.3 |
| Daily or almost daily | 11.7 | 17.0 | 23.2 | 30.0 | 22.6 | 20.0 | 19.1 | 20.1 | 23.9 | 22.0 | 19.8 | 16.2 |
| Physical activity (MET-h/week) | 44.3 (44.2) | 45.5 (45.5) | 45.4 (45.6) | 43.9 (46.7) | 46.5 (43.4) | 46.3 (45.8) | 43.6 (45.5) | 42.7 (47.3) | 42.8 (47.0) | 44.7 (46.4) | 45.8 (44.9) | 45.9 (43.7) |
| History of hypertension | 45.9 | 50.0 | 55.6 | 63.4 | 42.4 | 50.2 | 57.6 | 64.7 | 66.6 | 57.7 | 49.4 | 41.1 |
| History of high cholesterol | 12.6 | 11.0 | 11.5 | 12.9 | 8.3 | 9.8 | 12.4 | 17.6 | 16.6 | 12.2 | 9.8 | 9.5 |
| History of NAFLD | 0.04 | 0.04 | 0.05 | 0.14 | 0.02 | 0.03 | 0.11 | 0.13 | 0.16 | 0.06 | 0.04 | 0.02 |
| Family history of diabetes | 21.7 | 20.7 | 20.4 | 22.1 | 19.3 | 20.4 | 21.7 | 23.5 | 23.4 | 21.2 | 20.3 | 20.1 |
| Aspirin use | 8.5 | 8.1 | 8.5 | 9.3 | 7.1 | 7.9 | 8.8 | 10.6 | 10.4 | 8.7 | 7.8 | 7.5 |
| Vitamin supplementation | 34.3 | 31.5 | 30.7 | 30.5 | 35.1 | 32.8 | 30.2 | 28.8 | 29.1 | 29.8 | 32.1 | 35.9 |
| Mineral supplementation | 14.8 | 12.3 | 11.5 | 10.5 | 15.3 | 13.5 | 10.9 | 9.4 | 9.3 | 11.0 | 12.8 | 16.1 |
| Lipid-lowering medication use | 11.5 | 10.0 | 10.6 | 11.8 | 7.5 | 8.6 | 11.3 | 16.4 | 15.4 | 11.1 | 8.8 | 8.5 |
| Diet quality score | 46.4 (13.6) | 44.5 (13.1) | 43.0 (12.8) | 41.4 (13.1) | 46.6 (12.8) | 45.0 (13.0) | 43.2 (13.2) | 40.5 (13.5) | 40.4 (13.3) | 42.7 (12.9) | 44.8 (12.9) | 47.5 (13.0) |
| GRS | 414.9 (12.8) | 414.4 (12.4) | 414.3 (12.2) | 414.8 (12.0) | 414.7 (13.1) | 414.3 (12.3) | 414.6 (12.1) | 414.8 (11.9) | 414.9 (11.9) | 414.5 (12.2) | 414.1 (12.2) | 414.9 (13.1) |
Values are means (SD) or percentages.
£1.00 = $1.30, €1.20.
Associations Between Plasma FA and T2D
A total of 3,052 individuals with T2D were documented during an average follow-up of 11.6 years (1,110,641 person-years). In the age- and sex-adjusted model (model 1), higher plasma concentrations of SFA and MUFA were associated with dramatically higher T2D risk. These positive relationships were attenuated but remained strong (both P trend < 0.001) (Table 2) after further adjustment for other demographic characteristics and lifestyle factors (model 2) and mutual adjustment for types of plasma FA (model 3). The multivariable-adjusted HR (95% CI) comparing extreme quartiles of plasma FA were 1.72 (1.46–2.02) for SFA and 1.87 (1.48–2.37) for MUFA. In contrast, plasma PUFA concentrations were inversely associated with risk of T2D (multivariable-adjusted HR comparing the highest quartile with the lowest quartile: 0.67, 95% CI 0.51–0.89; P trend = 0.005). Similarly, plasma n-3 and n-6 PUFA concentrations were both significantly associated with a lower risk of T2D (both P trend < 0.001). Relative to mean values, each SD increment was related to reductions in T2D risk of 33% (27–39%) for plasma n-6 PUFA and 10% (5–15%) for plasma n-3 PUFA. Besides, inverse relationships were also detected for plasma linoleic acid (LA), non-LA n-6 PUFA, and nondocosahexenoic acid (non-DHA) n-3 PUFA (all P trend < 0.001) (Supplementary Table 8). Multivariable-adjusted HR (95% CI) of T2D for 1-SD increment were 0.67 (0.62–0.72) for LA, 0.89 (0.84–0.95) for non-LA n-6 PUFA, 0.93 (0.87–1.00) for DHA, and 0.90 (0.85–0.96) for non-DHA n-3 PUFA. We also observed a weak relationship between the n-6–to–n-3 ratio and T2D risk (HR for 1-SD increment: 1.01, 95% CI 0.98–1.04; P trend = 0.042). Restricted cubic spline regression also manifested similar results for these plasma FA (Fig. 1 and Supplementary Fig. 3).
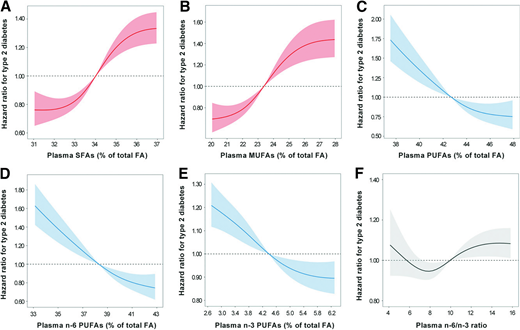
Dose-response relationships between plasma FA and T2D risk. HR for T2D associated with plasma SFA (A), MUFA (B), PUFA (C), n-6 PUFA (D), n-3 PUFA (E), and n-6–to–n-3 ratio (F) were estimated by restricted cubic-spline regression adjusted for age, sex, race, centers, BMI, education, Townsend deprivation index, household income, smoking, alcohol consumption, physical activity, history of hypertension, history of high cholesterol, family history of diabetes, vitamin supplement use, mineral supplement use, aspirin use, and remaining plasma fatty acids (SFA, MUFA, PUFA, n-6 PUFA, and n-3 PUFA). Shaded areas represent 95% CI.
Dose-response relationships between plasma FA and T2D risk. HR for T2D associated with plasma SFA (A), MUFA (B), PUFA (C), n-6 PUFA (D), n-3 PUFA (E), and n-6–to–n-3 ratio (F) were estimated by restricted cubic-spline regression adjusted for age, sex, race, centers, BMI, education, Townsend deprivation index, household income, smoking, alcohol consumption, physical activity, history of hypertension, history of high cholesterol, family history of diabetes, vitamin supplement use, mineral supplement use, aspirin use, and remaining plasma fatty acids (SFA, MUFA, PUFA, n-6 PUFA, and n-3 PUFA). Shaded areas represent 95% CI.
Associations between plasma FA and T2D risk
| Quartiles of plasma FA (% of total FA) | ||||||
|---|---|---|---|---|---|---|
| Q1 | Q2 | Q3 | Q4 | P trend | HR (95% CI)* | |
| SFA | ||||||
| Range | ≤32.7 | 32.7–33.9 | 33.9–35.1 | ≥35.1 | ||
| Median | 31.9 | 33.3 | 34.4 | 36.1 | ||
| Cases/person-years | 479/280,179 | 571/278,691 | 682/278,095 | 1,320/273,675 | ||
| Model 1† | 1.00 | 1.19 (1.06–1.35) | 1.39 (1.24–1.56) | 2.62 (2.36–2.91) | <0.001 | 1.04 (1.03–1.05) |
| Model 2‡ | 1.00 | 1.34 (1.19–1.52) | 1.50 (1.33–1.69) | 2.50 (2.24–2.79) | <0.001 | 1.04 (1.03–1.04) |
| Model 3§ | 1.00 | 1.20 (1.05–1.38) | 1.21 (1.04–1.41) | 1.72 (1.46–2.02) | <0.001 | 1.03 (1.02–1.04) |
| MUFA | ||||||
| Range | ≤21.5 | 21.5–23.1 | 23.1–25.0 | ≥25.0 | ||
| Median | 20.5 | 22.3 | 23.9 | 26.5 | ||
| Cases/person-years | 261/281,386 | 435/279,281 | 740/277,544 | 1,616/272,431 | ||
| Model 1† | 1.00 | 1.61 (1.38–1.88) | 2.67 (2.32–3.08) | 5.93 (5.20–6.78) | <0.001 | 1.06 (1.06–1.07) |
| Model 2‡ | 1.00 | 1.29 (1.10–1.51) | 1.72 (1.48–1.99) | 2.91 (2.52–3.36) | <0.001 | 1.04 (1.04–1.05) |
| Model 3§ | 1.00 | 1.16 (0.97–1.39) | 1.33 (1.08–1.64) | 1.87 (1.48–2.37) | <0.001 | 1.03 (1.02–1.05) |
| PUFA | ||||||
| Range | ≤40.5 | 40.5–43.1 | 43.1–45.2 | ≥45.2 | ||
| Median | 38.3 | 42.0 | 44.2 | 46.5 | ||
| Cases/person-years | 1,631/272,204 | 718/277,027 | 420/279,861 | 283/281,549 | ||
| Model 1† | 1.00 | 0.44 (0.40–0.48) | 0.27 (0.24–0.30) | 0.18 (0.16–0.21) | <0.001 | 0.43 (0.41–0.45) |
| Model 2‡ | 1.00 | 0.57 (0.52–0.63) | 0.42 (0.37–0.46) | 0.29 (0.26–0.34) | <0.001 | 0.54 (0.52–0.57) |
| Model 3§ | 1.00 | 0.86 (0.75–0.98) | 0.79 (0.65–0.96) | 0.67 (0.51–0.89) | 0.005 | 0.62 (0.56–0.68) |
| n-6 PUFA | ||||||
| Range | ≤36.2 | 36.2–38.7 | 38.7–40.8 | ≥40.8 | ||
| Median | 34.1 | 37.6 | 39.7 | 42.0 | ||
| Cases/person-years | 1,586/272,532 | 700/277,225 | 440/279,375 | 326/281,508 | ||
| Model 1† | 1.00 | 0.45 (0.41–0.49) | 0.29 (0.26–0.33) | 0.23 (0.21–0.26) | <0.001 | 0.47 (0.45–0.49) |
| Model 2‡ | 1.00 | 0.58 (0.53–0.63) | 0.44 (0.40–0.49) | 0.36 (0.32–0.41) | <0.001 | 0.59 (0.56–0.61) |
| Model 3§ | 1.00 | 0.81 (0.72–0.92) | 0.76 (0.64–0.90) | 0.72 (0.57–0.90) | <0.001 | 0.67 (0.61–0.73) |
| n-3 PUFA | ||||||
| Range | ≤3.3 | 3.3–4.2 | 4.2–5.2 | ≥5.2 | ||
| Median | 2.8 | 3.8 | 4.6 | 6.0 | ||
| Cases/person-years | 939/276,512 | 866/277,367 | 655/278,386 | 592/278,375 | ||
| Model 1† | 1.00 | 0.88 (0.80–0.96) | 0.64 (0.58–0.71) | 0.55 (0.49–0.61) | <0.001 | 0.77 (0.74–0.80) |
| Model 2‡ | 1.00 | 0.95 (0.87–1.04) | 0.75 (0.68–0.84) | 0.72 (0.64–0.80) | <0.001 | 0.86 (0.82–0.90) |
| Model 3§ | 1.00 | 0.94 (0.86–1.04) | 0.77 (0.69–0.86) | 0.82 (0.72–0.93) | <0.001 | 0.90 (0.85–0.95) |
| n-6–to–n-3 ratio | ||||||
| Range | ≤7.2 | 7.2–9.1 | 9.1–11.6 | ≥11.6 | ||
| Median | 6.1 | 8.2 | 10.2 | 14.0 | ||
| Cases/person-years | 776/277,075 | 748/277,849 | 775/277,817 | 753/277,900 | ||
| Model 1† | 1.00 | 1.02 (0.92–1.12) | 1.10 (0.99–1.21) | 1.12 (1.01–1.24) | 0.013 | 1.04 (1.01–1.08) |
| Model 2‡ | 1.00 | 0.99 (0.89–1.09) | 1.03 (0.93–1.15) | 1.00 (0.90–1.12) | 0.802 | 0.99 (0.96–1.03) |
| Model 3§ | 1.00 | 0.97 (0.88–1.08) | 1.06 (0.96–1.18) | 1.09 (0.98–1.22) | 0.042 | 1.01 (0.98–1.04) |
Indicates HR of T2D for 1-SD increment in plasma FA (% of total FA).
Model 1 was adjusted for age and sex.
Model 2 was further adjusted for race (White, Asian, Black, mixed, or other ethnic group), centers (22 categories), BMI (in kg/m2; <18.5, 18.5–25, 25–30, 30–35, ≥35, or missing), education (college or university degree, vocational qualifications, optional national exams at ages 17–18 years, national exams at age 16 years, others, or missing), Townsend deprivation index (quartiles), household income (<£18,000, £18,000–£30,999, £31,000–£51,999, £52,000–£100,000, >£100,000, or missing), smoking (never, former, current, or missing), alcohol consumption (never or special occasions only, 1–3 times/month, 1 or 2 times/week, 3 or 4 times/week, or daily/almost daily), physical activity (in MET-h/week; quartiles), history of hypertension (yes or no), history of high cholesterol (yes or no), family history of diabetes (yes or no), vitamin supplement use (yes or no), mineral supplement use (yes or no), and aspirin use (yes or no).
Model 3 was further adjusted for remaining plasma fatty acids (SFA, MUFA, PUFA, n-6 PUFA, and n-3 PUFA).
Interactions Between Plasma FA and GRS on T2D Risk
There was a significant positive interaction between plasma MUFA and the overall GRS on risk of developing T2D (P for interaction = 0.030) in the analysis of continuous standardized values (Table 3). In category analysis, increased plasma MUFA were associated with more increases in risk of T2D among participants with higher GRS. HR (95% CI) associated with 1-SD increment in plasma MUFA were 1.01 (0.98–1.05), 1.06 (1.03–1.09), and 1.07 (1.04–1.1), respectively, across tertiles of GRS (Fig. 2A). No significant interactions were observed between the other plasma FA and GRS (Table 3 and Supplementary Table 9).

Genetic risk and FA-associated alleles modify the associations of plasma MUFA and n-3 PUFA with risk of T2D. Plots show HR of T2D associated with 1-SD increment in plasma MUFA across tertiles of overall GRS (A), tertiles of proinsulin GRS (B), tertiles of liver/lipid GRS (C), and number of MUFA-associated alleles (D), and HR of T2D associated with 1-SD increment in plasma n-3 PUFA across quartiles of obesity GRS (E), tertiles of liver/lipid GRS (F) and number of DPA-associated alleles (G). HR were estimated using Cox proportional hazards regression models adjusted for covariates listed the in Table 3 footnote. Vertical lines represent 95% CI.
Genetic risk and FA-associated alleles modify the associations of plasma MUFA and n-3 PUFA with risk of T2D. Plots show HR of T2D associated with 1-SD increment in plasma MUFA across tertiles of overall GRS (A), tertiles of proinsulin GRS (B), tertiles of liver/lipid GRS (C), and number of MUFA-associated alleles (D), and HR of T2D associated with 1-SD increment in plasma n-3 PUFA across quartiles of obesity GRS (E), tertiles of liver/lipid GRS (F) and number of DPA-associated alleles (G). HR were estimated using Cox proportional hazards regression models adjusted for covariates listed the in Table 3 footnote. Vertical lines represent 95% CI.
Interactions of plasma FA with GRS and pathway-specific GRS for T2D
| GRS (n loci = 424) | |||||||||
|---|---|---|---|---|---|---|---|---|---|
| Plasma FA | GRS | Plasma FA × GRS | |||||||
| β | SE | P | β | SE | P | β | SE | P | |
| SFA | 0.031 | 0.007 | <0.001 | 0.411 | 0.020 | <0.001 | 0.005 | 0.005 | 0.273 |
| MUFA | 0.041 | 0.009 | <0.001 | 0.406 | 0.020 | <0.001 | 0.012 | 0.006 | 0.030 |
| PUFA | −0.492 | 0.050 | <0.001 | 0.403 | 0.025 | <0.001 | −0.016 | 0.024 | 0.497 |
| n-6 PUFA | −0.423 | 0.046 | <0.001 | 0.407 | 0.024 | <0.001 | −0.013 | 0.023 | 0.589 |
| n-3 PUFA | −0.117 | 0.031 | <0.001 | 0.410 | 0.020 | <0.001 | −0.014 | 0.023 | 0.530 |
| n-6–to–n-3 ratio | 0.045 | 0.021 | 0.027 | 0.414 | 0.020 | <0.001 | −0.002 | 0.020 | 0.919 |
| β-cell cluster (n loci = 30) | |||||||||
|---|---|---|---|---|---|---|---|---|---|
| Plasma FA | β-cell GRS | Plasma FA × β-cell GRS | |||||||
| β | SE | P | β | SE | P | β | SE | P | |
| SFA | 0.028 | 0.007 | <0.001 | 0.213 | 0.020 | <0.001 | −0.006 | 0.009 | 0.491 |
| MUFA | 0.031 | 0.008 | <0.001 | 0.218 | 0.021 | <0.001 | −0.010 | 0.013 | 0.435 |
| PUFA | −0.509 | 0.050 | <0.001 | 0.223 | 0.024 | <0.001 | 0.014 | 0.023 | 0.556 |
| n-6 PUFA | −0.437 | 0.046 | <0.001 | 0.217 | 0.024 | <0.001 | 0.004 | 0.023 | 0.874 |
| n-3 PUFA | −0.123 | 0.030 | <0.001 | 0.220 | 0.020 | <0.001 | 0.030 | 0.022 | 0.176 |
| n-6–to–n-3 ratio | 0.039 | 0.020 | 0.049 | 0.213 | 0.019 | <0.001 | −0.009 | 0.019 | 0.622 |
| Proinsulin cluster (n loci = 7) | |||||||||
|---|---|---|---|---|---|---|---|---|---|
| Plasma FA | Proinsulin GRS | Plasma FA × proinsulin GRS | |||||||
| β | SE | P | β | SE | P | β | SE | P | |
| SFA | 0.034 | 0.007 | <0.001 | 0.088 | 0.020 | <0.001 | −0.016 | 0.008 | 0.062 |
| MUFA | 0.045 | 0.008 | <0.001 | 0.097 | 0.021 | <0.001 | −0.022 | 0.009 | 0.012 |
| PUFA | −0.500 | 0.050 | <0.001 | 0.089 | 0.025 | <0.001 | 0.010 | 0.024 | 0.664 |
| n-6 PUFA | −0.430 | 0.045 | <0.001 | 0.083 | 0.025 | <0.001 | 0.001 | 0.023 | 0.973 |
| n-3 PUFA | −0.118 | 0.030 | <0.001 | 0.090 | 0.021 | <0.001 | 0.028 | 0.023 | 0.227 |
| n-6–to–n-3 ratio | 0.037 | 0.020 | 0.055 | 0.084 | 0.020 | <0.001 | −0.011 | 0.019 | 0.543 |
| Obesity cluster (n loci = 5) | |||||||||
|---|---|---|---|---|---|---|---|---|---|
| Plasma FA | Obesity GRS | Plasma FA × obesity GRS | |||||||
| β | SE | P | β | SE | P | β | SE | P | |
| SFA | 0.028 | 0.007 | <0.001 | 0.029 | 0.019 | 0.137 | 0.003 | 0.005 | 0.550 |
| MUFA | 0.036 | 0.008 | <0.001 | 0.024 | 0.020 | 0.233 | 0.008 | 0.006 | 0.186 |
| PUFA | −0.502 | 0.050 | <0.001 | 0.045 | 0.024 | 0.065 | 0.025 | 0.023 | 0.287 |
| n-6 PUFA | −0.432 | 0.045 | <0.001 | 0.035 | 0.024 | 0.138 | 0.009 | 0.023 | 0.677 |
| n-3 PUFA | −0.117 | 0.030 | <0.001 | 0.038 | 0.020 | 0.057 | 0.046 | 0.022 | 0.038 |
| n-6–to–n-3 ratio | 0.037 | 0.019 | 0.060 | 0.028 | 0.019 | 0.145 | −0.014 | 0.019 | 0.440 |
| Lipodystrophy cluster (n loci = 20) | |||||||||
|---|---|---|---|---|---|---|---|---|---|
| Plasma FA | Lipodystrophy GRS | Plasma FA × lipodystrophy GRS | |||||||
| β | SE | P | β | SE | P | β | SE | P | |
| SFA | 0.028 | 0.007 | <0.001 | 0.119 | 0.020 | <0.001 | −0.005 | 0.011 | 0.666 |
| MUFA | 0.033 | 0.009 | <0.001 | 0.124 | 0.022 | <0.001 | −0.010 | 0.016 | 0.511 |
| PUFA | −0.495 | 0.050 | <0.001 | 0.117 | 0.025 | <0.001 | 0.009 | 0.023 | 0.706 |
| n-6 PUFA | −0.425 | 0.046 | <0.001 | 0.114 | 0.024 | <0.001 | 0.005 | 0.022 | 0.824 |
| n-3 PUFA | −0.115 | 0.030 | <0.001 | 0.117 | 0.020 | <0.001 | 0.005 | 0.023 | 0.811 |
| n-6–to–n-3 ratio | 0.039 | 0.020 | 0.046 | 0.117 | 0.020 | <0.001 | −0.009 | 0.017 | 0.591 |
| Liver/lipid cluster (n loci = 5) | |||||||||
|---|---|---|---|---|---|---|---|---|---|
| Plasma FA | Liver/lipid GRS | Plasma FA × liver/lipid GRS | |||||||
| β | SE | P | β | SE | P | β | SE | P | |
| SFA | 0.034 | 0.007 | <0.001 | 0.081 | 0.020 | <0.001 | 0.018 | 0.013 | 0.177 |
| MUFA | 0.046 | 0.009 | <0.001 | 0.066 | 0.021 | 0.002 | 0.035 | 0.014 | 0.010 |
| PUFA | −0.515 | 0.050 | <0.001 | 0.093 | 0.025 | <0.001 | −0.007 | 0.023 | 0.750 |
| n-6 PUFA | −0.447 | 0.045 | <0.001 | 0.084 | 0.024 | <0.001 | −0.020 | 0.023 | 0.384 |
| n-3 PUFA | −0.110 | 0.030 | <0.001 | 0.095 | 0.020 | <0.001 | 0.045 | 0.023 | 0.045 |
| n-6–to–n-3 ratio | 0.034 | 0.020 | 0.086 | 0.086 | 0.020 | <0.001 | −0.027 | 0.018 | 0.135 |
Cox proportional hazards regression models for type 2 diabetes were performed using standardized values of plasma FA and GRS. β-Coefficients were adjusted for age, sex, centers, BMI, education, Townsend deprivation index, household income, smoking, alcohol consumption, physical activity, history of hypertension, history of high cholesterol, vitamin supplement use, mineral supplement use, aspirin use, and remaining plasma FA (SFA, MUFA, PUFA, n-6 PUFA, and n-3 PUFA).
For pathway-specific GRS, significant interactions of plasma MUFA with GRS on T2D risk for proinsulin cluster (P for interaction = 0.012) and liver/lipid cluster (P for interaction = 0.010) were detected (Table 3). Of note, plasma n-3 PUFA had significant positive interactions with obesity GRS (P for interaction = 0.038) and liver/lipid GRS (P for interaction = 0.045) on risk of T2D. In category analysis, the inverse associations of plasma n-3 PUFA with T2D were weaker among participants with higher obesity GRS (P for interaction = 0.040) (Fig. 2E). In the analysis stratified by tertiles of liver/lipid GRS, plasma n-3 PUFA were related to significant reductions in T2D risk only among participants in the lowest tertile of liver/lipid GRS (P for interaction = 0.012) (Fig. 2F).
Interactions Between Plasma FA and FA-Associated SNP on T2D Risk
Significant interactions were found between plasma MUFA and the number of MUFA-associated alleles and between plasma n-3 PUFA and the number of docosapentaenoic acid (DPA)-associated alleles (Supplementary Table 10). An increment in plasma MUFA was related to less increase in T2D risk among participants with more MUFA-associated alleles (P for interaction = 0.006) (Fig. 2D). The inverse associations of plasma n-3 PUFA with T2D risk were stronger among individuals with more DPA-associated alleles (T allele of rs780094 in GCKR, C allele of rs3734398 in ELOVL2, and T allele of rs174547 in FADS1). HR (95% CI) associated with 1-SD increment in plasma n-3 PUFA were 0.97 (0.88–1.06) among individuals with zero to two DPA-associated alleles, 0.88 (0.82–0.96) among those with three to four alleles, and 0.75 (0.61–0.94) among those with five to six alleles (P for interaction = 0.007) (Fig. 2G). Regarding specific SNP, we only detected a significant interaction between rs16966952 in NTAN1 and non-LA n-6 PUFA (P for interaction = 0.019) (Supplementary Table 11).
Subgroup Analyses
In subgroup analyses, the associations of plasma MUFA, PUFA, n-6 PUFA, and DHA with T2D risk were more pronounced among women than men (Supplementary Table 12). We observed stronger positive associations of plasma SFA with T2D risk among older people and those with a family history of diabetes. The positive associations of plasma MUFA with T2D risk were weaker among participants who had hypercholesteremia and those with a healthier diet. Additionally, the inverse associations of plasma PUFA and n-6 PUFA were more evident among nonsmokers, alcohol consumers, nonhypertensive subjects, those without hypercholesteremia, and those who did not use aspirin. All documented associations were similar among individuals with a higher or lower healthy lifestyle score (all P interaction > 0.05).
Sensitivity Analyses
The documented significant relationships between plasma FA and risk of T2D remained unchanged after further adjustment for lipid-lowering medications, glucosamine, hormone replacement therapy and oral contraceptive use, sleep pattern, history of NAFLD, or diet quality score (Supplementary Table 13). Our findings also remained similar after further excluding participants with HbA1c level ≥48 mmol/mol or glucose level ≥11.1 mmol/L, incident T2D cases that occurred within the first 2 years, individuals with extreme BMI, or those with missing covariate data (Supplementary Table 13).
Conclusions
In this large cohort study of 95,854 individuals, plasma SFA and MUFA concentrations were associated with a higher risk of developing T2D, while n-6 PUFA, n-3 PUFA, and their sum were related to a lower T2D risk. The positive associations of plasma MUFA with T2D risk were stronger among individuals with a higher genetic risk. The inverse associations of plasma n-3 PUFA with T2D risk were weaker among individuals with higher GRS for obesity and liver/lipid clusters. Additionally, increased plasma n-3 PUFA were associated with more reductions in T2D risk among participants with more DPA-associated alleles.
Although traditional research indicated that total SFA intake could impair insulin sensitivity and glucose tolerance due to its lipotoxicity, literature-based meta-analyses of cohort studies on dietary SFA intake and T2D risk (5,25) have not supported the recommendation of reducing SFA intake, which requires studies using objectively measured biomarkers of SFA. Several previous cohort studies using circulating levels of total SFA reported conflicting results (8,26), which could be due to the small sample size (all n < 7,000). Our study has a large sample size (n = 95,854) to detect a robust positive relationship between plasma total SFA and T2D risk. Besides, we found the adverse effects were comparable across all gradients of genetic T2D risk in the population. Altogether, our results support public health efforts that generally advise lowering SFA intake to reduce the risk of developing T2D. However, apart from exogenous intake, circulating SFA could also be derived from endogenous synthesis, such as the de novo lipogenesis (DNL) pathway (27). Factors that stimulate DNL, including carbohydrate and alcohol intake, could also contribute to the harmful association.
The positive relationship between MUFA intake and T2D risk was reported by a recent meta-analysis of 102,350 individuals with self-reported dietary data (16). One possible reason was that the MUFA intake was highly correlated with SFA intake due to the shared food sources, such as meats and dairy products, and thus could be confounded by the adverse effect of SFA (3). However, in our study, plasma MUFA were weakly correlated with plasma SFA (r = 0.26), which could be due to the endogenous synthesis process of SFA. Thus, our finding reflects the effect of metabolic exposure to MUFA on risk of T2D. In accordance with our results, a meta-analysis of 14 metabolomics studies of T2D cohorts found a 1.87-fold higher T2D risk associated with oleic acid (OA) (28), which is the most abundant MUFA. For putative mechanisms, MUFA, including OA and palmitic acid, were shown to cause significant toxicity to human β-cells and impair insulin secretion (29,30). Notably, a high level of OA promoted the adipogenesis of 3T3-L1 cells along with impaired insulin signaling via DNA methylation (31). Therefore, epigenetic alterations as a mediator or gene-MUFA interactions may play a part in T2D development. As expected, we found the adverse associations of plasma MUFA with T2D risk were stronger among participants with higher GRS and also detected significant interactions with proinsulin and liver/lipid clusters. These interactions were biologically plausible. MUFA were evidenced to inhibit cell cycle regulator CCND2 (32) and HNF4α gene expression, which stimulated β-cell replication in diabetes with reduced β-cell mass (33). Besides, OA treatment was often used to establish in vitro models of steatosis and insulin resistance in HepG2 cells via regulating genes involved in lipid homeostasis, including PNPLA3 (34). Genetic variants associated with the endogenous synthesis of MUFA, including stearoyl CoA desaturases in the DNL pathway (27), could affect the circulating levels of MUFA. We showed that the harmful relationship was attenuated by alleles associated with MUFA levels, which indicated that the endogenous synthesis of MUFA could have mediated the adverse relationship. Similarly, although dietary MUFA from plant sources have been associated with lower risk of cardiovascular disease (35,36), some studies also reported harmful relations of circulating MUFA with cardiovascular disease risk, which could be due to DNL that promoted intrahepatic fat storage (37,38).
In contrast to SFA and MUFA, essential linoleic acid (LA) and α-linolenic acid (ALA), the most abundant PUFA, could not be synthesized de novo in humans. Therefore, circulating PUFA levels were more correlated with dietary intakes and should be used more intensively to inform future dietary guidelines. Although there is a prevailing concern regarding the relationship between increasing n-6 PUFA and prevalence of obesity-related metabolic diseases, the detrimental effect was not proven (39), and increasing evidence showed n-6 PUFA had protective associations with incident T2D. The European Prospective Investigation into Cancer and Nutrition (EPIC)-InterAct study found that per SD increment in circulating LA levels was related to 20% lower risk of T2D (9), which was further supported by a pooled analysis of 20 cohort studies (11). Our findings were consistent with these studies, and no evidence of interactions between plasma n-6 PUFA and genetic risk of T2D was detected, indicating dietary guidelines should continue to recommend the consumption of LA-rich vegetable oils for all individuals to prevent T2D.
Regarding n-3 PUFA, results from human observational studies have also been mixed (5). The latest meta-analysis of randomized controlled trials (RCT) suggested no protective effect of n-3 PUFA supplements on the new diagnosis of diabetes (6). Nonetheless, most of these trials lasted for only a few years, and the sample sizes were inadequate. Moreover, findings from these trials were difficult to generalize to larger and more inclusive populations because of the designated patients and other well-known limitations of RCT (40). In contrast to RCT testing n-3 PUFA supplements, using circulating levels of n-3 PUFA could better reflect the bioavailability of n-3 PUFA intake. In a pooled analysis of 65,147 participants from 14 countries, increased levels of marine n-3 PUFA in blood were associated with reduced risk of T2D (10). Besides, the EPIC-InterAct study across eight European countries observed an inverse relationship between plant-derived n-3 ALA and T2D risk (9). Our finding extends and expands the previous evidence to support clinical recommendations to increase n-3 PUFA intake for the primary prevention of T2D. Interestingly, we found the protective association was mainly driven by plasma non-DHA n-3 PUFA but not DHA, which was generally consistent with the previous meta-analysis (9) showing no association for DHA but a borderline inverse association for DPA. Notably, we further detected that individuals carrying more effect alleles in genes, including ELOVL2 and FADS1, involved in the synthesis of DPA had more reductions in T2D risk associated with increased plasma n-3 PUFA, indicating a protective role of DPA in T2D prevention. Interestingly, we observed significant antagonistic interactions of plasma n-3 PUFA with GRS for obesity and liver/lipid clusters. n-3 PUFA have been suggested to ameliorate lipid metabolism and potentially treat obesity (41) which is a major risk factor for T2D. Similarly, in three U.S. cohorts, habitual n-3 PUFA consumption attenuated overall genetic predisposition on long-term weight changes (42). Some specific genetic variants were also reported to interact with n-3 PUFA on risk of obesity (43). An RCT of patients with NAFLD showed that 1-year n-3 supplementation decreased the probability of severe steatosis with a greater response among PNPLA3 148I allele carriers (44). These data collaborated with our findings and suggested n-3 PUFA interact with lipid metabolism pathways to prevent the onset of T2D. Individuals with lower genetic risk for the lipid metabolic pathway and those carrying more DPA-associated alleles may be more likely to derive benefit from n-3 PUFA consumption.
In our study, we observed lower plasma MUFA levels, whereas higher PUFA levels in women than men, and the associations of these FA with T2D were more pronounced in women. In addition to sex differences in dietary intakes, the interaction between sex and plasma FA could result from sex differences in the activity of enzymes, such as elongase 6 and delta-6-desaturase, which are involved in the endogenous synthesis and metabolism of MUFA and PUFA (45–47).
Our study has important strengths, including the large population size, long duration of follow-up, and use of objectively measured plasma levels of FA. In addition, we took advantage of a large number of T2D-associated SNP (n = 424) to construct the overall GRS and also used the novel pathway-specific clusters of GRS.
Some limitations merit attention. First, plasma PUFA seemed to be a marker for a healthy lifestyle; thus, we carefully controlled for various lifestyle factors in our analyses. The documented inverse association of plasma PUFA was consistent among participants with healthier or unhealthier lifestyles, suggesting that the observed relationships were not likely due to the correlation with healthier lifestyles.
Second, we could not analyze the relationships for more specific subtypes of plasma FA, such as SFA with different chain lengths, n-6 arachidonic acid and n-3 eicosapentaenoic acid, and DPA due to the lack of available data.
Third, plasma levels of FA were only measured at baseline, and changes over time may tend to dilute real associations between plasma FA and T2D toward the null. Because plasma FA levels reflect both dietary intake and endogenous synthesis, the documented relationships could not be interpreted as entirely attributable to dietary FA.
Fourth, residual confounding cannot be fully excluded despite the adjustment of extensive covariates.
Fifth, T2D cases in our study were ascertained by hospital records, self-report, or death registration, which may not be perfectly accurate. The delay in the ascertainment of incident T2D cases was possible. However, this would occur virtually independent of plasma FA levels and thus might not cause serious bias.
Sixth, the generalizability of our findings to non-European ethnic groups could be limited.
Finally, the causality of relationships could not be determined due to the observational nature.
Conclusions and Implications
In conclusion, we showed that plasma SFA and MUFA had adverse associations with incident T2D, whereas plasma PUFA, including n-6 and n-3 PUFA, had protective associations. The positive associations of plasma MUFA with T2D risk were stronger among individuals with higher T2D genetic risk while weaker among those carrying more alleles related to the endogenous synthesis of MUFA. The inverse associations of plasma n-3 PUFA were weaker among those with higher genetic risk for the lipid metabolic pathway. Reductions in T2D risk associated with plasma n-3 PUFA were greater among participants carrying more DPA-associated alleles. Results from this study provide useful clinical answers as we expect precision nutrition to be widely used in clinical and public health settings. Our findings generally support current dietary recommendations but also emphasize that personalized approaches on improving plasma FA profiles for T2D prevention should be tailored according to individuals’ genetic profiles. Further genotype-based recall clinical trials are required to collaborate our findings.
This article contains supplementary material online at https://doi.org/10.2337/figshare.17430542.
Article Information
Acknowledgments. This research was conducted using the UK Biobank resource. The authors thank the participants of the UK Biobank. This research has been conducted using the UK Biobank Resource under Application Number 47365.
Funding. This research was supported by the National Natural Science Foundation of China (grant no. 81773419), and China Postdoctoral Science Foundation (grant no. 2020M681869).
The funders had no role in design and conduct of the study, collection, management, analysis, and interpretation of the data, preparation, review, and approval of the manuscript, or the decision to submit the manuscript for publication.
Duality of Interest. No potential conflicts of interest relevant to this article were reported.
Author Contributions. P.Z. wrote the manuscript. P.Z., X.L., Y.L., X.W., Y.W., H.L., L.Z., and J.J. did the data cleaning, analysis, and interpretation. P.Z., Y.Z., and J.J. were involved in data acquisition. X.L. provided statistical expertise and assistance. Y.Z. and J.J. conceived and designed the study. All authors contributed to the interpretation of the data and critical revision of the manuscript for important intellectual content and approved the final draft. J.J. is the guarantor of this work and, as such, had full access to all the data in the study and takes responsibility for the integrity of the data and the accuracy of the data analysis.