


To define the relationship between glucose and C-peptide during the progression to type 1 diabetes (T1D).
We longitudinally studied glucose and C-peptide response curves (GCRCs), area under curve (AUC) for glucose, and AUC C-peptide from oral glucose tolerance tests (OGTTs), and Index60 (which integrates OGTT glucose and C-peptide values) in Diabetes Prevention Trial–Type 1 (DPT-1) (n = 72) and TrialNet Pathway to Prevention Study (TNPTP) (n = 82) participants who had OGTTs at baseline and follow-up time points before diagnosis.
Similar evolutions of GCRC configurations were evident between DPT-1 and TNPTP from baseline to 0.5 years prediagnosis. Whereas AUC glucose increased throughout from baseline to 0.5 years prediagnosis, AUC C-peptide increased from baseline until 1.5 years prediagnosis (DPT-1, P = 0.004; TNPTP, P = 0.012) and then decreased from 1.5 to 0.5 years prediagnosis (DPT-1, P = 0.017; TNPTP, P = 0.093). This change was mostly attributable to change in the late AUC C-peptide response (i.e., 60- to 120-min AUC C-peptide). Median Index60 values of DPT-1 (1.44) and TNPTP (1.05) progressors to T1D 1.5 years prediagnosis (time of transition from increasing to decreasing AUC C-peptide) were used as thresholds to identify individuals at high risk for T1D in the full cohort at baseline (5-year risk of 0.75–0.88 for those above thresholds).
A transition from an increase to a decrease in AUC C-peptide ∼1.5 years prediagnosis was validated in two independent cohorts. The median Index60 value at that time point can be used as a pathophysiologic-based threshold for identifying individuals at high risk for T1D.
Introduction
The Diabetes Prevention Trial–Type 1 (DPT-1) (1,2) and the TrialNet Pathway to Prevention Study (TNPTP) (3) have offered insights into the metabolic progression to type 1 diabetes (T1D) (1–7). Both studies included autoantibody-positive relatives of patients with T1D, who are at increased risk for diabetes. Participants in these studies were followed with oral glucose tolerance tests (OGTTs) for diagnostic surveillance, during which C-peptide measurements were obtained in addition to glucose.
Findings from those studies suggest an acceleration of metabolic decline (inflection point) that begins ∼1–2 years prior to diagnosis. In the DPT-1 cohort, a marked decline in the C-peptide response from 0 to 30 min and a decrease in β-cell glucose sensitivity occurred during that period (3,4,6). In an analysis of progressors to T1D who were followed for >5 years in the TNPTP cohort, an accelerated decline in C-peptide occurred ∼1 year prior to diagnosis (7). However, there has not yet been a clear delineation of the time at which accelerated decline begins.
The main objective of this study was to define the relationship between glucose and C-peptide leading up to and following the inflection point. This is of importance, since the inflection point’s relationship to changes in immunologic and environmental factors could provide insight into disease pathogenesis. Also, it could serve as an anchor for determining an optimal time before diagnosis to assess a potential treatment in a prevention trial. Moreover, translating the metabolic state following this transitional period to the risk of T1D might provide a pathophysiologic basis for the selection of prevention trial participants.
Here, we used a novel analytic approach based on a two-dimensional glucose and C-peptide grid (2dgrid) to better define the timing of the inflection point using both glucose and C-peptide simultaneously and, importantly, understand it in the context of metabolic progression before and after it occurs. This entailed using the 2dgrid to examine the changing longitudinal relationship between glucose and C-peptide during progression. Further, to evaluate the validity of the findings, we performed the same analyses in the DPT-1 and TNPTP cohorts.
Research Design and Methods
Procedures
Data included in this analysis were obtained at baseline from relatives positive for pancreatic autoantibodies who participated in either DPT-1 or TNPTP. All individuals in DPT-1 underwent serial OGTTs every 6 months. In TNPTP, subjects had serial OGTTs every 6 or 12 months depending on their degree of risk. In both DPT-1 and TNPTP, American Diabetes Association diagnostic criteria were used for the diagnosis of diabetes. If fasting and/or 2-h glucose was in the diabetes range at the visits, a confirmatory OGTT was performed. However, if the clinical presentation was clearly indicative of a diagnosis, an OGTT was not performed. Of the 82 progressors in TNPTP, 30 did not have an OGTT at diagnosis, while 15 of the 72 DPT-1 progressors did not have a diagnostic OGTT. For this reason, OGTTs at diagnosis were not included in the analysis. C-peptide was measured with radioimmunoassay in DPT-1 and Tosoh assay in TNPTP. The glucose oxidase method was used to measure glucose in both studies. Methodologies for autoantibody testing in DPT-1 and TNPTP have previously been described (8).
Data Analysis
To be included in the analysis, only DPT-1 and TNPTP participants who had complete OGTT data at baseline and then every 6 months from 2 years to 6 months before diagnosis were included (DPT-1, n = 72; TNPTP, n = 82). Combined glucose and C-peptide response curves (GCRCs) (9,10) were formed from OGTTs by plotting of the mean values of glucose and C-peptide at 30, 60, 90, and 120-min on 2dgrids, with glucose as the y-axis and C-peptide as the x-axis. The GCRC forms a polygon when a line is drawn to connect the values from 30 to 120 min, and the central point location (centroid) of the polygon is then calculated, as was previously described (9,10). The trapezoidal rule was used to calculate the areas under the curve (AUC) for glucose and C-peptide. Mean AUC glucose and mean AUC C-peptide values from OGTTs were also plotted on a 2dgrid at the time points before diagnosis, with AUC glucose as the y-axis and AUC C-peptide as the x-axis. t tests and χ2 tests were used for comparisons of differences in metabolic measures.
Data and Resource Availability
The data were analyzed or generated during the study and are available on request from the authors.
Results
Characteristics at baseline of those followed longitudinally in DPT-1 (n = 72) and TNPTP (n = 82) are shown in Supplementary Table 1. TNPTP participants were older (P < 0.05); however, BMI values were similar. Mean ± SD duration between baseline and diagnosis was 3.7 ± 1.0 and 4.7 ± 2.4 years for those followed in DPT-1 and TNPTP, respectively.
Serial GCRCs on 2dgrids Before Diagnosis
Supplementary Table 2 displays AUC glucose and AUC C-peptide values at each visit prior to diagnosis from those followed longitudinally in DPT-1 and TNPTP. Glucose values tended to be higher in the TNPTP group than in the DPT-1 group at baseline and 2.0 years before diagnosis; however, values were similar between groups at subsequent visits. C-peptide values were consistently higher at each visit in the TNPTP cohort (P < 0.001 for all time points).
We next examined GCRCs from serial OGTTs. Figure 1 shows GCRCs formed from the mean glucose and C-peptide values at 30, 60, 90, and 120 min from OGTTs plotted on a 2dgrid for each of the DPT-1 and TNPTP cohorts. All had OGTTs at the following visits prior to diagnosis: baseline and 2.0, 1.5, 1.0, and 0.5 years. In both cohorts, a change in GCRC configuration was most evident in the increasingly positive 30- to 60-min slope [Δglucose (mg/dL) / ΔC-peptide (ng/ml)] (Supplementary Table 3), gradually changing from downward trending or horizontal trending at baseline to mostly upward trending 0.5 years before diagnosis (−0.28 at baseline to 1.21 at 0.5 years in DPT-1 and 0.22 at baseline to 0.63 at 0.5 years in TNPTP). The slopes were most alike 1.5 years before diagnosis in both cohorts (0.51 in DPT-1 and 0.45 in TNPTP).
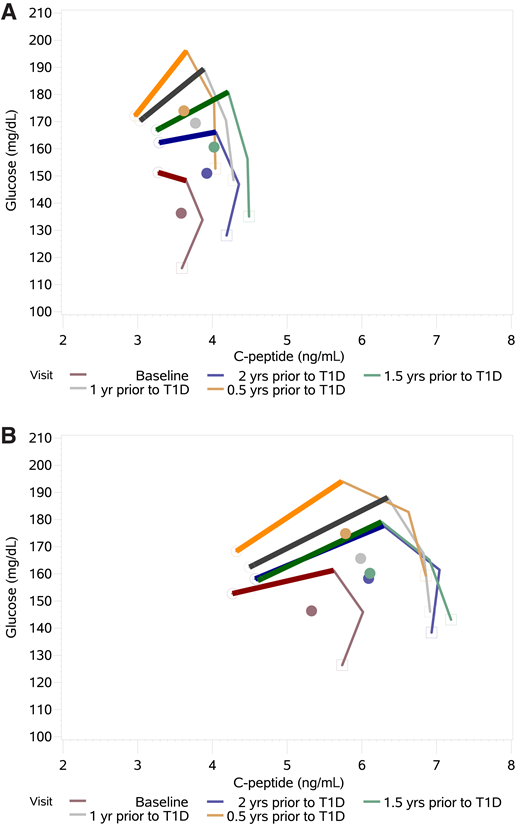
Shown are GCRCs from 30, 60, 90, and 120 min time points on a 2dgrid in 72 DPT-1 (A) and 82 TNPTP (B) participants who had OGTTs at baseline and then at 2.0, 1.5, 1.0, and 0.5 years (yrs) before diagnosis of T1D. In both studies there is a gradual increase of the 30- to 60-min slope (scaled) during progression (see Supplementary Table 3). Also, in both studies there is movement of the GCRCs toward higher C-peptide levels, followed by a decline at ∼1.5 years before diagnosis as glucose levels continue to increase. This pattern of movement is particularly evident from inspection of the GCRC centroids (central points).
Shown are GCRCs from 30, 60, 90, and 120 min time points on a 2dgrid in 72 DPT-1 (A) and 82 TNPTP (B) participants who had OGTTs at baseline and then at 2.0, 1.5, 1.0, and 0.5 years (yrs) before diagnosis of T1D. In both studies there is a gradual increase of the 30- to 60-min slope (scaled) during progression (see Supplementary Table 3). Also, in both studies there is movement of the GCRCs toward higher C-peptide levels, followed by a decline at ∼1.5 years before diagnosis as glucose levels continue to increase. This pattern of movement is particularly evident from inspection of the GCRC centroids (central points).
Serial AUCs of Glucose and C-peptide on 2dgrids Prior to Diagnosis
We analyzed the movement of the GCRCs on the 2dgrid by plotting the mean AUC glucose and mean AUC C-peptide from the time points prior to diagnosis (Fig. 2A). The patterns of movement were similar between DPT-1 and TNPTP. In DPT-1, AUC glucose increased continuously throughout, while AUC C-peptide increased along with AUC glucose from baseline until ∼1.5 years before diagnosis (P = 0.004) and then declined from 1.5 to 0.5 years (P = 0.017). In TNPTP, as AUC glucose increased throughout from baseline, AUC C-peptide increased until 2.0 years before diagnosis (P = 0.012). There was little change in either AUC glucose or AUC C-peptide from 2.0 to 1.5 years, but then, similar to DPT-1, AUC C-peptide declined from 1.5 to 0.5 years before diagnosis (P = 0.093) as AUC glucose increased. This resulted in a shift of direction in both cohorts from rightward and upward to leftward and upward at ∼1.5 years, as is evident in the figure. GCRC centroids had similar directionality, rightward and upward until ∼1.5 years before diagnosis and then leftward and upward until 0.5 years before diagnosis (Fig. 1).

Shown are three panels of 2dgrid representing the nexus of mean AUC glucose and AUC C-peptide from OGTTs in 72 DPT-1 and 82 TNPTP participants at baseline and then at 2.0, 1.5, 1.0, and 0.5 years (yrs) prior to diagnosis. A shows similar movement of the overall AUCs between DPT-1 and TNPTP. The initial movement toward higher AUC C-peptide levels with a subsequent decline at ∼1.5 years has similarity with the centroid pattern in Fig. 1. B and C include curves of the AUC C-peptide partitioned into 0- to 30-min (early) and 60- to 120-min (later) AUC responses. For both DPT-1 (B) and TNPTP (C) there is more of a resemblance of the overall AUC curves in A to the later AUC curves than to the early AUC C-peptide curves. B, baseline. *P < 0.05; *P < 0.01; *P < 0.001. All changes of AUC glucose from baseline to 1.5 years and from 1.5 years to 0.5 years were significant at *P < 0.001. The change of early C-peptide from baseline to 1.5 years was significant at *P < 0.05 in TNPTP.
Shown are three panels of 2dgrid representing the nexus of mean AUC glucose and AUC C-peptide from OGTTs in 72 DPT-1 and 82 TNPTP participants at baseline and then at 2.0, 1.5, 1.0, and 0.5 years (yrs) prior to diagnosis. A shows similar movement of the overall AUCs between DPT-1 and TNPTP. The initial movement toward higher AUC C-peptide levels with a subsequent decline at ∼1.5 years has similarity with the centroid pattern in Fig. 1. B and C include curves of the AUC C-peptide partitioned into 0- to 30-min (early) and 60- to 120-min (later) AUC responses. For both DPT-1 (B) and TNPTP (C) there is more of a resemblance of the overall AUC curves in A to the later AUC curves than to the early AUC C-peptide curves. B, baseline. *P < 0.05; *P < 0.01; *P < 0.001. All changes of AUC glucose from baseline to 1.5 years and from 1.5 years to 0.5 years were significant at *P < 0.001. The change of early C-peptide from baseline to 1.5 years was significant at *P < 0.05 in TNPTP.
In pairwise comparisons, there were no significant differences between mean AUC C-peptide from baseline to 0.5 years in either group despite the markedly increased AUC glucose in that interval. For further assessment of the changes in AUC C-peptide in relation to changes in AUC glucose, the AUC ratio [AUC C-peptide (ng/mL) / AUC glucose (mg/dL)] was used. Indeed, mean ± SD AUC ratio was significantly lower at 0.5 years before diagnosis than at baseline in both cohorts (DPT-1, 2.54 ± 1.27 at baseline vs. 2.03 ± 0.91 at 0.5 years, P < 0.001; TNPTP, 3.49 ± 1.36 at baseline vs. 3.14 ± 1.58 at 0.5 years, P < 0.05). Thus, whereas the AUC ratio captured the deteriorating state of β-cells from baseline to 0.5 years before diagnosis in both studies, AUC C-peptide alone failed to do so; the interpretation of the change in AUC C-peptide differs greatly when the context of AUC glucose is taken into account.
We also performed an analysis for nonprogressors to T1D during follow-up (Supplementary Table 4). Definitions for the intervals of the time points were the same, except that those for OGTTs were defined according to time before diagnosis for progressors and according to time before the last visit for nonprogressors. In contrast to AUC glucose in progressors, AUC glucose in nonprogressors changed to a small degree. Although AUC C-peptide in nonprogressors increased similarly to that in progressors from baseline to 2 years before the last visit, there was little change thereafter, without the decline observed in progressors at 1.5 years.
Figure 2B and C shows the relation of changes in AUC glucose levels to AUC C-peptide levels for progressors after partitioning of AUC C-peptide into intervals from 0 to 30 min (early response) and from 60 to 120 min (later response). These intervals were chosen to avoid a common or overlapping 30-min time point. In both DPT-1 and TNPTP, the early response curve only faintly resembled the overall response curve. As AUC glucose increased, there was a slight tendency for AUC C-peptide to increase from baseline to 2 years before diagnosis, with little change thereafter. This contrasts with the later response curve, which resembled the overall response curve: the change in direction from rightward and upward to leftward and upward was again evident ∼1.5 years before diagnosis.
Figure 2 shows that the internal angles of the vectors from baseline to 1.5 years and 1.5 years to 0.5 years are similar between the overall AUC C-peptide and the later AUC C-peptide in both DPT-1 and TNPTP. This further suggests that the change in direction of C-peptide is mainly a function of the later C-peptide response. Supplementary Tables 5 and 6 show the similarity in trends between overall AUC C-peptide and later AUC C-peptide in DPT-1 and TNPTP.
The Inflection Point As an Indicator of Risk for T1D
We assessed whether the directional turn of AUC C-peptide at 1.5 years before diagnosis was indicative of a pathophysiologic threshold above which the risk for T1D was high. To examine this, we first identified the median values of AUC glucose, AUC ratio, and Index60 1.5 years before diagnosis among progressors followed longitudinally in TNPTP and in DPT-1. These median values were then used as risk thresholds for T1D at the baseline OGTTs of the full TNPTP (n = 6,567) and DPT-1 (n = 711) cohorts (baseline demographic values of cohorts shown in Supplementary Table 1). To achieve independence, we removed the baseline values of the 82 TNPTP progressors from the baseline values of the full TNPTP cohort and removed the baseline values of the 72 DPT-1 progressors from the baseline values of the full DPT-1 cohort. Thus, after subtraction, 6,485 from TNPTP and 639 from DPT-1 were included for those specific analyses.
The 5-year risks of T1D among those above the thresholds (i.e., the median values for the 82 in TNPTP and 72 in DPT-1 followed longitudinally at 1.5 years before diagnosis) at baseline are shown in Table 1. The 5-year risks for T1D among those above the TNPTP thresholds at baseline were similar between AUC glucose and Index60 (0.72 and 0.75) and lower with use of AUC ratio (0.53). Similar, though slightly higher, risks were seen when the same thresholds were applied to the baseline DPT-1 cohort (0.79 for both AUC glucose and Index60 and 0.55 for AUC ratio). However, when the DPT-1 thresholds were used, the 5-year risks tended to be higher among those above the Index60 threshold than those above the AUC glucose threshold (Table 2).
Prediction of T1D at baseline according to status of above or below* median values of metabolic indices of 82 TNPTP progressors who were 1.5 years (time of transition from increasing to decreasing values) before diagnosis
| Median (Q1, Q3) 1.5 years before diagnosis in TNPTP | TNPTP (N = 6,485)** | DPT-1 (N = 639) | |||||
|---|---|---|---|---|---|---|---|
| N (%) >median* | % 5-year T1D risk (95% CI) | Hazard ratio (95% CI) | N (%) >median* | % 5-year T1D risk (95% CI) | Hazard ratio (95% CI) | ||
| AUC glucose (mg/dL) | 159.4 (137.9, 175.7) | 1,222 (18.6) | 71.5 (67.7, 75.1) | 9.77 (8.68, 11.00) | 94 (13.2) | 78.8 (67.8, 87.9) | 4.13 (3.12, 5.49) |
| AUC ratio | 3.14 (2.41, 4.48) | 1,841 (28.0) | 53.1 (50.1, 56.3) | 5.84 (5.17, 6.59) | 424 (59.6) | 54.6 (48.9, 60.4) | 2.53 (1.92,3.35) |
| Index60 | 1.05 (0.18, 1.67) | 1,241 (18.9) | 74.7 (71.4, 78.0) | 12.22 (10.82, 13.79) | 208 (29.3) | 78.8 (71.6, 85.1) | 4.70 (3.68, 6.00) |
Q, quartile.
Below median for AUC ratio.
We did not include the 82 TNPTP progressors in the TNPTP baseline cohort so as to achieve independence. P value <0.001 for all estimates.
Prediction of T1D at baseline according to status of above or below* median values of metabolic indices of 72 DPT-1 progressors who were 1.5 years (time of transition from increasing to decreasing values) before diagnosis
| Median (Q1, Q3) 1.5 years before diagnosis in DPT-1 | TNPTP (N = 6,485) | DPT-1 (N = 639)** | |||||
|---|---|---|---|---|---|---|---|
| N (%) >median* | % 5-year T1D risk (95% CI) | Hazard ratio (95% CI) | N (%) >median* | % 5-year T1D risk (95% CI) | Hazard ratio (95% CI) | ||
| AUC glucose (mg/dL) | 158.5 (137.9, 167.4) | 1,222 (18.6) | 71.5 (67.7, 75.1) | 9.77 (8.68, 11.00) | 97 (13.6) | 77.6 (66.7, 87.0) | 4.00 (3.03, 5.28) |
| AUC ratio | 2.22 (1.59, 3.09) | 1,841 (28.0) | 53.1 (50.1, 56.3) | 5.84 (5.17, 6.59) | 213 (30.0) | 66.4 (58.7, 74.0) | 2.79 (2.19, 3.56) |
| Index60 | 1.44 (1.12, 1.76) | 1,241 (18.9) | 74.7 (71.4, 78.0) | 12.22 (10.82, 13.79) | 111 (15.6) | 87.5 (78.4, 94.1) | 5.06 (3.89, 6.58) |
Q, quartile.
Below median for AUC ratio.
We did not include the 72 DPT-1 progressors in the DPT-1 baseline cohort so as to achieve independence. P value <0.001 for all estimates.
Conclusions
In both the DPT1-1 and TNPTP cohorts, we observed that among individuals progressing to T1D, there was increasing AUC C-peptide, followed by a transition to decreasing AUC C-peptide as AUC glucose continued to increase. The metabolic state during the transition was used to select a pathophysiologic-based threshold for identification of individuals at high risk for T1D during the baseline OGTT. These novel findings were obtained in large part with use of geometric approaches in the analyses.
The time at which C-peptide loss accelerates prediagnosis has commonly been referred to as an inflection point. However, based on the finding that decrease in C-peptide is preceded by increasing C-peptide, it would be more descriptive to use the term C-peptide transition phase (CpepTP). This would make it clear that C-peptide is the specific metabolic measure that is in transition and that the pathologic process is not a sudden occurrence, as a time point would suggest. CpepTP will be used hereafter.
Three phases can be defined on the basis of the CpepTP: 1) a partial compensatory increase in C-peptide as glucose increases prior to the CpepTP, 2) the CpepTP itself from an increasing to a decreasing C-peptide as glucose continues to increase, 3) a decline in C-peptide following the CpepTP with glucose levels approaching the range for diabetes. These phases are not necessarily indicative of distinct pathologic changes per se. However, the separation into phases based on the CpepTP provides a structure for exploring and understanding metabolic progression proximal to diagnosis.
The increase in AUC C-peptide prior to the 1.5-year transition phase appears to be indicative of a response to compensate for β-cell dysfunction, such as an insufficient first-phase insulin response. If so, such compensation could result from an “enhanced” later β-cell response during OGTTs (11). The partitioning of the OGTTs into early (0–30 min) and later (60–120 min) AUC C-peptide responses suggested that the increase in AUC C-peptide is mostly attributable to a later C-peptide response. This later response appears to be critical. In prior studies of GCRCs (9,10), a dependency on later C-peptide responsiveness was manifested by the changing shape of the GCRC just before and after diagnosis.
We assessed whether we could use CpepTP to identify individuals at baseline whose metabolic state would be comparable with the metabolic state of the CpepTP as T1D approaches. This could be of value, since studies suggest that even with advanced β-cell dysfunction before diagnosis, interventions can delay β-cell loss (12,13). Following individuals until a CpepTP is reached appears to be inefficient and impractical. Thus, we used another approach: applying findings from the longitudinal analysis of the TNPTP participants prior to diagnosis to the full TNPTP cohort at baseline. When median values of AUC glucose and Index60 1.5 years before diagnosis were used as risk thresholds for individuals at baseline, those above the thresholds had a high 5-year risk for T1D. The CpepTP uniquely provides a pathophysiologic basis for selecting a threshold that is suggestive of future severe functional β-cell loss. This study is the first to specifically relate the risk of T1D to pathologic evidence of evolving metabolic decline.
Due to the requirement of an OGTT at each 6-month visit prior to diagnosis for the longitudinal analysis, there was too large an attrition in the interval from baseline to 2 years before diagnosis to determine when AUC C-peptide levels began to increase in the progressors. Even if such data were available for that interval, it is possible that the initial increase would have occurred before baseline.
With use of the TNPTP thresholds of the TNPTP progressors, the AUC glucose threshold was found to be equivalent to the Index60 threshold in the prediction analysis. However, with use of the thresholds of the DPT-1 progressors, Index60 identified individuals at higher risk than AUC glucose. Although glucose measures are good predictors of diabetes in autoantibody-positive populations, they have not been as accurate as combined glucose and C-peptide measures in several studies that have been undertaken (10). Moreover, we have found that those diagnosed with diabetes by glucose thresholds alone have more atypical characteristics of T1D in comparison with diagnosis with a combination of C-peptide with glucose (10).
Despite the high risks among those above the AUC glucose and Index60 thresholds derived from the distributions at the time of the CpepTP, T1D will not necessarily be diagnosed within a few years. The differing outcomes could result from differences in the constitutional makeup of β-cells (including mass or an inherent resiliency for their recovery), the presence or absence of protective factors, and/or the degree of continuing (or waxing and waning) damage perpetrated by immunologic or pathologic factors.
The 1.5-year prediagnostic timing that marked the transition from increasing to decreasing C-peptide was similar in DPT-1 and TNPTP and consistent with the 1- to 2-year timing of metabolic decline observed in prior studies (3,4,6,7). However, it is important to highlight that this report differs from the others in several respects: 1) changes of glucose and C-peptide were examined in the context of each other, which provided more insight into the basis for metabolic decline; 2) a 2dgrid and GCRCs were able to better define the timing and patterns of change; 3) the acceleration of metabolic decline prior to diagnosis was shown to represent a decrease in C-peptide following a compensatory increase of C-peptide rather than simply a decrease in C-peptide; 4) the decline in C-peptide appeared to be mostly a function of later C-peptide responsiveness; 5) the DPT-1 and TNPTP cohorts were both studied to confirm the findings; and 6) prediction thresholds for selecting individuals at high risk at baseline were derived from the findings, particularly the identification of the CpepTP.
There are caveats to consider in interpreting the findings. It should be kept in mind that the timing of CpepTP before diagnosis was an average, not necessarily indicative of an individual. Also, despite the similarity in the timing of CpepTP prior to diagnosis between DPT-1 and TNPTP, there was insufficient granularity in the frequency of OGTT sampling to identify a more precise estimate. In addition, increasing glucose together with decreasing C-peptide within an individual could represent temporary fluctuations rather than the CpepTP.
A limitation of the study is the possibility that the findings may not be generalizable, since the analysis was restricted to those who had OGTTs at all designated time points prior to diagnosis in autoantibody-positive at-risk relatives. However, the precision of the analysis was greater than the numbers might appear to indicate, since the same individuals were followed, thus eliminating interindividual variation. Still, subgroups, such as by sex and age, could not be meaningfully analyzed due to the reduced numbers in the subgroups. A strength of the study is that findings were validated in two independent autoantibody-positive cohorts. Given the differences in characteristics between the two cohorts, the similarity in findings suggests that they will extend to other autoantibody-positive populations.
In conclusion, CpepTP is a marker that represents an advanced metabolic phase of progression to T1D. CpepTP potentially provides a pathophysiologic basis for defining populations, since it can be tied to the risk of the disorder. This could enhance the selection of individuals who would be more likely to respond to specific preventive treatments. Importantly, the CpepTP provides a focus for studying pathogenic mechanisms in the development of T1D.
This article contains supplementary material online at https://doi.org/10.2337/figshare.20217056.
Members of the Type 1 Diabetes TrialNet Study Group and TrialNet Affiliate Sites can be found in the supplementary material.
Article Information
Acknowledgments. The authors acknowledge the support of the Type 1 Diabetes TrialNet Study Group, which identified study participants and provided samples and follow-up data for this study. Members of the Type 1 Diabetes TrialNet Study Group and TrialNet Affiliate Sites are listed in Supplementary Material.
Funding. The Type 1 Diabetes TrialNet Study Group is a clinical trials network funded by the National Institutes of Health (NIH) through the National Institute of Diabetes and Digestive and Kidney Diseases, the National Institute of Allergy and Infectious Diseases, and the Eunice Kennedy Shriver National Institute of Child Health and Human Development, through cooperative agreements U01 DK061010, U01 DK061034, U01 DK061042, U01 DK061058, U01 DK085453, U01 DK085461, U01 DK085465, U01 DK085466, U01 DK085476, U01 DK085499, U01 DK085504, U01 DK085509, U01 DK103180, U01 DK103153, U01 DK103266, U01 DK103282, U01 DK106984, U01 DK106994, U01 DK107013, U01 DK107014, UC4 DK106993, UC4 DK11700901, U01 DK 106693-02, and JDRF. This work was also made possible with support from grants KL2TR002530 (A. Carroll, Principal Investigator [PI]) and UL1TR002529 (A. Shekhar, PI) from the NIH, Clinical and Translational Sciences Award, National Center for Advancing Translational Sciences, and NIH grants R01 DK121843 (to M.J.R.) and R01 DK124395 (to M.J.R.).
The contents of this article are solely the responsibility of the authors and do not necessarily represent the official views of the NIH or JDRF.
Duality of Interest. No potential conflicts of interest relevant to this article were reported.
Author Contributions. H.M.I. and J.S. conceptualized the study. H.M.I., D.C., and J.S. analyzed and interpreted data and wrote the manuscript. S.E.G., J.S.S., A.K.S., H.R., M.A., B.M.N., M.J.R., K.C.H., C.E.-M., and L.A.D. contributed to the study design, interpreted data, and reviewed and edited the manuscript. H.M.I., D.C., and J.S. are the guarantors of this work and, as such, had full access to all the data in the study and take responsibility for the integrity of the data and the accuracy of the data analysis.
Prior Presentation. Parts of this study were presented in abstract form at the 78th Scientific Sessions of the American Diabetes Association, Orlando, FL, 22–26 June 2018, and at the 79th Scientific Sessions of the American Diabetes Association, San Francisco, CA, 7–11 June 2019.