


To distinguish the effects of hyperglycemia and hyperinsulinemia on exercise-induced increases in Rd and endogenous glucose production (EGP) in type 1 diabetes.
We studied six participants without diabetes and six participants with type 1 diabetes on three visits in random order for the following: euglycemia, low insulin (EuLoI); euglycemia, high insulin (EuHiI); and hyperglycemia, low insulin (HyLoI). Glucose fluxes were measured using [6,6-2H2] glucose before, during, and after 60 min of exercise.
Rd increased (P < 0.01) with exercise within groups, while peak Rd during exercise was lower (P < 0.01) in participants with type 1 diabetes than participants without diabetes during all visits. In type 1 diabetes participants, EGP increased (P < 0.001) with exercise during EuLoI and HyLoI but not during EuHiI. This demonstrates that hyperinsulinemia, but not hyperglycemia, blunts the compensatory exercise-induced increase in EGP in type 1 diabetes.
The data from this pilot study indicate that 1) exercise-induced compensatory increase in EGP was inhibited in participants with type 1 diabetes with hyperinsulinemia but not with hyperglycemia; 2) in contrast, in participants without diabetes, exercise-induced increase in EGP was inhibited only during combined hyperinsulinemia and hyperglycemia. Taken together, these results suggest that low insulin coupled with euglycemia or modest hyperglycemia appear to be the most favorable milieu for type 1 diabetes during exercise.
Introduction
Regular exercise is an essential component of physical well-being and maintenance of good health. Exercise is especially beneficial in people with type 1 and type 2 diabetes. People with type 1 diabetes are often physically unfit compared with people without diabetes due to fear of hypoglycemia related to exercise, which prevents them from leading an active and healthy lifestyle (1–3). Management strategies to mitigate exercise-induced hypoglycemia during and after completion of exercise have ranged from frequent ingestion of simple carbohydrates to empiric reductions in insulin dosing preceding and during exercise to the use of minidoses of glucagon (4–7). Automated insulin delivery systems (putative closed loop artificial pancreas) coupled with rapid advances in sensing technologies have also grappled with this challenge without arriving at a consistent and reliable therapeutic solution (8–11).
To fashion informed and rational therapeutic strategies for prevention of exercise-induced hypoglycemia, a better understanding of exercise-induced changes to carbohydrate turnover is necessary in people with type 1 diabetes. In the clinical scenario, patients with type 1 diabetes often query their physicians as to an optimal ambient glucose level when a bout of exercise would be deemed safe with a low risk of subsequent hypoglycemia. Using state-of-the-art isotope dilution techniques, we recently demonstrated for type 1 diabetes participants (12,13) that moderate-grade exercise (50% VO2max) 2 h after a mixed meal leads to a robust compensatory increase in rates of endogenous glucose production (EGP) to counteract the exercise-induced increase in Rd. This occurred despite higher glucose and lower glucagon concentrations observed in people with type 1 diabetes than matched participants without diabetes.
Circulating concentrations of insulin (derived from exogenously injected insulin), glucose, and glucagon are the primary regulators of glucose fluxes in type 1 diabetes with all three factors influencing EGP, while glucose and insulin regulate Rd. There have been a handful of studies that examined carbohydrate turnover related to exercise in type 1 diabetes participants. In an elegant series of experiments, Petersen et al. (14) observed that gluconeogenesis rather than glycogenolysis contributed to hepatic glucose production during moderate- and high-intensity exercise. A recent report demonstrated increasing rates of glucose appearance and disappearance with increasing intensities of exercise from 35% to 80% VO2max in type 1 diabetes participants under euglycemic conditions (15). However, it is noteworthy that under conditions of daily living, people with type 1 diabetes frequently prefer to be at a modestly hyperglycemic state at the start of exercise to provide themselves with a protective cushion against exercise-induced hypoglycemia. The purpose of this study was, therefore, to distinguish between the effects of circulating glucose and/or insulin concentrations, spanning the physiological ranges, on exercise-induced changes to EGP and Rd in patients with type 1 diabetes. Participants without diabetes were also studied to determine the extent to which these parameters differed from health.
It is also noteworthy that in contrast to people with type 2 diabetes who are insulin resistant and have relative insulin deficiency, people with type 1 diabetes have absolute endogenous insulin deficiency due to autoimmune destruction of their pancreatic β-cells. Hence their circulating insulin concentrations represent that obtained from exogenous insulin administration. To put this into perspective, the hyperinsulinemia we allude to in this study closely mimics plasma concentrations of exogenously administered insulin often observed in the postprandial state in people with type 1 diabetes.
Research Design and Methods
Subjects
Following approval by the Mayo Clinic Institutional Review Board, six participants without diabetes and six with type 1 diabetes were enrolled in this pilot study. They were matched for age, fat-free mass (FFM), and VO2max and were eligible if they met the following inclusion criteria: age 18–65 years, BMI 19–40 kg/m2, creatinine ≤1.5 mg/dL or estimated glomerular filtration rate of >49 mL/min, and normotensive; negative pregnancy test in premenopausal women; and no history of macrovascular disease. For type 1 diabetes participants, additional inclusion criteria were as follows: HbA1c ≤11%, on insulin pump therapy, and no history of diabetic microvascular complications except for stable background retinopathy.
Protocol
Screening Visit
All participants reported to the Mayo Clinic Clinical Research Trials Unit (CRTU) in the morning after an overnight fast. After informed consent, medical history, and physical examination, laboratory tests were done to ensure that they met enrollment criteria. A pregnancy test was performed, where appropriate, and a negative result was confirmed before proceeding. Body composition was measured using DEXA. Participants also performed a graded exercise test on a bike to determine VO2max and heart rate responses to maximum exercise. The VO2max was used to determine the intensity of exercise during the study visits. Participants who met enrollment criteria were asked to report for the following study visits in random order.
For VO2max testing, the test, which was performed under medical supervision on a bicycle ergometer, was started at 50 W and was increased by 25 W every 3 min until volitional exhaustion. Respiratory gases and heart rate were monitored continuously, and blood pressure was checked periodically. Participants were considered to have reached their peak when 1) their respiratory exchange ratio value was >1.1, 2) leveling off of their oxygen consumption despite an increasing workload, and 3) a heart rate within 10% of their age-predicted maximum (16).
Euglycemia and Low-Insulin Clamp
Participants were admitted to the CRTU at ∼4 p.m. on the evening before the study (Fig. 1). They were provided with a standard 10 kcal/kg evening meal at ∼1700 h (20% protein, 50% carbohydrate, and 30% fat). Type 1 diabetes participants administered their customary bolus dose of insulin according to their insulin-to-carbohydrate ratio with the evening meal and the insulin pump continued at the basal rates. No additional food was eaten until the end of the study, but participants were permitted to have sips of water. In the morning of the study, periodic blood draws were done via a catheter inserted in a retrograde fashion into a hand vein via the heated-hand vein technique (12). Additionally, up to two intravenous cannulae were placed in forearm veins of the contralateral arm for tracer and glucose infusions.
![Figure 1. Schematic outline of the experimental design. The top panel shows three randomized visits with levels of glycemia and insulin infusion rates. The bottom panel shows the infusion patterns of 50% dextrose with [6,6-2H2] glucose, insulin, and [6,6-2H2] glucose during study visits.](https://ada.silverchair-cdn.com/ada/content_public/journal/care/43/9/10.2337_dc20-0611/6/m_dc200611f1.jpeg?Expires=1716294725&Signature=LZHkcgiF5Y1GmIlUhTq0zc~M1VD6aDWzAv2lgvqcXmlOCe9Mm3JWfVPYZcSr-VwM4pxDCuYTmMzZo9gbi~JfV-tIGNaNZPbC7KFEOd4XdqA0UXG69NdpY4e93r4J4q02nYLyfX2Hc48wVa~1D7gDZcrtSIjXybk4AFiDncGthsHalNm7dJ3aJOvt2CfuviBs5kjeEmhI18hZguvHhq9k0azxkWkckwMN2LXyjvdhZZzDL8Ie0~BUg-~1UF2nrjtU66GnAHVfL0LNnnD-c-LzgmutCTH3WJ2ysx9rNLTrfl8eb0K9VJRxhZPRgKz-u~ejtL0tEB9Id30iTgoW-B~6-w__&Key-Pair-Id=APKAIE5G5CRDK6RD3PGA)
Schematic outline of the experimental design. The top panel shows three randomized visits with levels of glycemia and insulin infusion rates. The bottom panel shows the infusion patterns of 50% dextrose with [6,6-2H2] glucose, insulin, and [6,6-2H2] glucose during study visits.
Schematic outline of the experimental design. The top panel shows three randomized visits with levels of glycemia and insulin infusion rates. The bottom panel shows the infusion patterns of 50% dextrose with [6,6-2H2] glucose, insulin, and [6,6-2H2] glucose during study visits.
At −60 min (0700) an infusion of [6,6-2H2] glucose (∼33 µmol/kg prime and 0.33 µmol/kg/min continuous) was started and continued until the end of study. At time zero (0800), an intravenous infusion of regular insulin was started at a rate of 0.25 mU/kg/min until end of study (17). The insulin pump was discontinued in subjects with type 1 diabetes at the start of the intravenous insulin infusion. Then, 50% dextrose containing [6,6-2H2] glucose was infused in amounts sufficient to clamp glucose at ∼5.5 mmol/L (100 mg/dL). In addition, the basal infusions of [6,6-2H2] glucose were changed beginning at time zero in a pattern that mimicked the anticipated changes in glucose production to minimize the changes in plasma tracer-tracee ratio, as previously described (17,18). At 120 min, subjects exercised on a bicycle ergometer for 60 min at 65% VO2max.
At the end of exercise, subjects remained resting until the end of the study at 1300 when all infusions were stopped and all cannulae were removed. A meal was provided, and participants with type 1 diabetes took their customary dose of insulin based on the insulin-to-carbohydrate ratio and resumed their insulin pump therapy before dismissal from the CRTU.
Euglycemia and High-Insulin Clamp
Hyperglycemia and Low-Insulin Clamp
This visit was identical to EuLoI except that the plasma glucose concentration was clamped at ∼180 mg/dL (∼10 mmol/L) throughout the study (Fig. 1).
Analytical Techniques
All blood samples were immediately placed on ice, centrifuged at 4°C, separated, and stored at −80°C until analyses. Plasma glucose was analyzed using a YSI 2300 (Yellow Springs, OH). Plasma insulin was measured using a chemiluminescence method with the Access Ultrasensitive Immunoenzymatic assay system (Beckman, Chaska, MN); C-peptide and glucagon concentrations were measured by radioimmunoassay (Linco Research Inc., St. Louis, MO); and [6,6-2H2] glucose enrichment was measured by gas chromatography–mass spectrometry, as previously described (18–20).
Calculations
The rates of glucose turnover were estimated, as previously described (21). Briefly, the total Ra and Rd were calculated using a single-compartment model of glucose kinetics (Steele) utilizing nonsteady-state calculations that have been used by us and others in the field (22). EGP is calculated by subtracting the glucose infusion rate from the rate of glucose appearance.
Statistical Considerations
This is a pilot study, and hence, the sample size for the study was not based on power considerations. The study protocol was designed to study six participants without diabetes and six with type 1 diabetes under two insulin conditions for administrative reasons and an understanding that 12 observations (i.e., pooled data for participants without diabetes and with type 1 diabetes for each insulin condition) would provide minimally sufficient data to estimate a CI (23). Serial data were calculated, and for the purposes of interpretable time events over the protocol, data were averaged into single values. Specifically, basal was defined as the mean of the assessments at −60 and 0 min; pre-exercise was defined as the mean of the assessments at 100 and 120 min; exercise was defined as the mean of the assessments at 170, 175, and 180 min; postexercise was the mean of the assessments at 190 and 200 min; and finally, the end of the protocol assessment was the mean of the assessments at 290 and 300 min.
For the analysis, a mixed model with random effect for subject was included. Fixed effects consisted of study group (participants with or without type 1 diabetes), study period (basal, pre-exercise, and so on), insulin infusion protocol, and all interactions up to the three-way interaction. Type III model contrasts were formed by comparing estimated means to provide structured estimation of comparisons of interest. Models and contrasts were estimated using the lme4 and lsmeans packages in R, respectively.
Results
Participant Characteristics
Six healthy (two female, age: 28.2 ± 10.4 years, FFM: 55.0 ± 10.8 kg, total body weight: 72.6 ± 7.9 kg, BMI: 23.6 ± 2.3 kg/m2, and VO2max: 36.6 ± 7.0 mL·kg−1·min−1) and six type 1 diabetes participants (three female, age: 28.7 ± 7.1 years, FFM: 56.2 ± 7.9 kg, total body weight: 87.8 ± 15.6 kg, BMI: 28.3 ± 4.8 kg/m2, VO2max: 28.7 ± 10.4 mL·kg−1·min−1, duration type 1 diabetes: 16 ± 11 years, HbA1c: 7.8 ± 1.6%, and HbA1c: 62.0 ± 17.4 mmol/mol) were studied.
Glucose, Insulin, and Glucagon Concentrations
Plasma glucose concentrations (left panels) were higher by design during hyperglycemia, low insulin (HyLoI), in both groups (Fig. 2). Plasma insulin concentrations (middle panels) were higher by design in type 1 diabetes in euglycemia, high insulin (EuHiI) compared with EuLoI and HyLoI. In subjects without diabetes, plasma insulin concentrations were higher by design in EuHiI than EuLoI, whereas during HyLoI, plasma insulin concentrations were also higher than in EuLoI due to the β-cell response to induced hyperglycemia. Plasma glucagon concentrations (right panels) did not differ between groups during all visits.
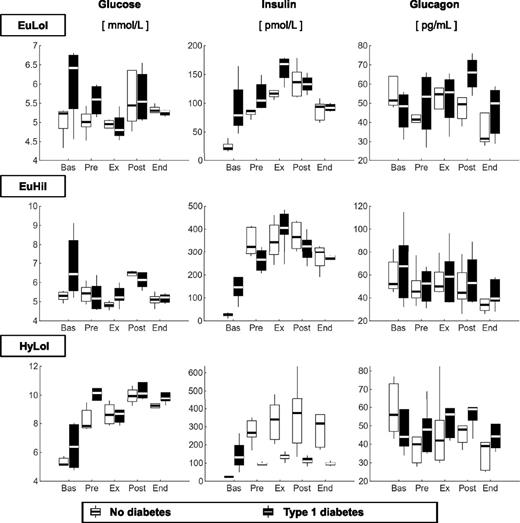
Box plots of glucose (left), insulin (middle), and glucagon (right) concentrations measured during basal (Bas), pre-exercise (Pre), exercise (Ex), postexercise (Post), and end (End) periods, in participants without diabetes (light gray) and participants with type 1 diabetes (dark gray). Values are given during EuLoI (top), EuHiI (middle), and HyLoI (bottom panels) studies.
Box plots of glucose (left), insulin (middle), and glucagon (right) concentrations measured during basal (Bas), pre-exercise (Pre), exercise (Ex), postexercise (Post), and end (End) periods, in participants without diabetes (light gray) and participants with type 1 diabetes (dark gray). Values are given during EuLoI (top), EuHiI (middle), and HyLoI (bottom panels) studies.
EGP and Glucose Disappearance
EGP (Fig. 3, left panel) during exercise were higher in participants with type 1 diabetes than those without diabetes during EuLoI and HyLoI but not during EuHiI (Fig. 3 and Table 1). It is noteworthy that glucose and insulin concentrations during exercise were comparable between groups during EuLoI and EuHiI but not during HyLoI, where insulin concentrations were higher in participants without diabetes than in those with type 1 diabetes due to β-cell insulin secretory response to induced hyperglycemia. Taken together, the data suggest that hyperinsulinemia, but not hyperglycemia, inhibits the exercise-induced compensatory rise in EGP in participants with type 1 diabetes.
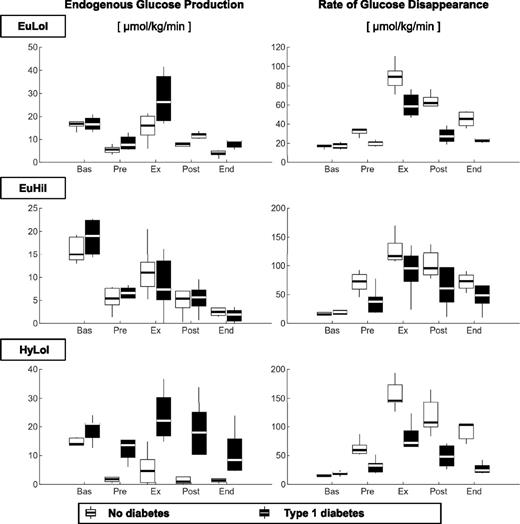
Box plots of EGP (left) and Rd (right panel) measured during basal (Bas), pre-exercise (Pre), exercise (Ex), postexercise (Post) and end (End) periods, in participants without diabetes (light gray) and participants with type 1 diabetes (dark gray). Values are given during EuLoI (top), EuHiI (middle), and HyLoI (bottom panels) studies.
Box plots of EGP (left) and Rd (right panel) measured during basal (Bas), pre-exercise (Pre), exercise (Ex), postexercise (Post) and end (End) periods, in participants without diabetes (light gray) and participants with type 1 diabetes (dark gray). Values are given during EuLoI (top), EuHiI (middle), and HyLoI (bottom panels) studies.
Mixed effect model analysis on EGP and glucose disappearance
| EGP (μmol/kg FFM/min) | Rd (μmol/kg FFM/min) | |||||
|---|---|---|---|---|---|---|
| EuLoI | EuHiI | HyLoI | EuLoI | EuHiI | HyLoI | |
| Exercise for participants without versus participants with type 1 diabetes | ||||||
| Estimated differences | −14.3 | 3.2 | −18.2 | 36.2 | 36.7 | 79.8 |
| 95% CI | (−21.0, −7.5) | (−3.0, −9.5) | (−24.5, −12.0) | (10.3, 62.1) | (12.9, 60.4) | (56.1, 103.6) |
| P value | 0.0001 | 0.30 | <0.0001 | 0.0067 | 0.0030 | <0.0001 |
| Pre-exercise versus exercise | ||||||
| Participants without diabetes | ||||||
| Estimated differences | −9.6 | −6.2 | −3.9 | −57.0 | −55.4 | −91.2 |
| 95% CI | (−14.6, −4.6) | (−11.2, −1.2) | (−8.9, 1.1) | (−77.0, −37.1) | (−75.3, −35.4) | (−111.1, −71.2) |
| P value | 0.0002 | 0.0149 | 0.123 | <0.0001 | <0.0001 | <0.0001 |
| Participants with type 1 diabetes | ||||||
| Estimated differences | −19.2 | −2.5 | −9.0 | −40.2 | −70.4 | −42.3 |
| 95% CI | (−25.3, −13.1) | (−7.5, 2.5) | (−14.0, −4.0) | (−64.6, −15.7) | (−30.5, −5.0) | (−62.2, −22.3) |
| P value | <0.0001 | 0.33 | 0.0005 | 0.0015 | <0.0001 | 0.0001 |
| EuLoI versus EuHiI | EuLoI versus HyLoI | EUHiI versus HyLoI | EuLoI versus EuHiI | EuHiI versus HyLoI | EhHyI versus HyLoI | |
|---|---|---|---|---|---|---|
| Exercise | ||||||
| Participants without diabetes | ||||||
| Estimated differences | 3.8 | 9.7 | 5.9 | −37.4 | −65.1 | −27.8 |
| 95% CI | (−1.2, 8.8) | (4.7, 14.7) | (0.9, 10.9) | (−57.3, −17.4) | (−45.2, −6.5) | (−47.7, −7.8) |
| P value | 0.137 | 0.0002 | 0.0204 | 0.0003 | <0.0001 | 0.0068 |
| Participants with type 1 diabetes | ||||||
| Estimated differences | 21.3 | 5.8 | −15.6 | −36.9 | −21.5 | 15.4 |
| 95% CI | (15.7, 26.9) | (0.1, 11.4) | (−20.5, −10.6) | (−59.4, −14.4) | (−44.0, 1.0) | (−4.6, 35.3) |
| P value | <0.0001 | 0.0452 | <0.0001 | 0.0015 | 0.061 | 0.130 |
Rd (Fig. 3, right panel) during exercise was lower in participants with type 1 diabetes than in participants without diabetes in all three visits with the differences accentuated in HyLoI where exercise-induced Rd was enhanced by both hyperglycemia and hyperinsulinemia in those without diabetes. Furthermore, in participants without diabetes, Rd during exercise was higher progressively and significantly from EuLoI to EuHiI to HyLoI. In contrast, in participants with type 1 diabetes, Rd during exercise was higher from EuLoI to EuHiI but not different between EuLoI and HyLoI or EuHiI and HyLoI study visits.
Conclusions
This study was designed to distinguish the effects of hyperglycemia and hyperinsulinemia, spanning the physiological range, on glucose turnover during moderate exercise in recreationally active participants with type 1 diabetes versus those without diabetes. We compared the effects of moderate hyperglycemia (∼9.3 mmol/L [∼165 mg/dL] vs. ∼5.5 mmol/L [100 mg/dL]) or modest physiological hyperinsulinemia (∼400 pmol/L [∼60 μU/mL] vs. ∼140 pmol/L [∼20 μU/mL]) on exercise-induced increase in rates of Rd and the compensatory increase in EGP in participants with type 1 diabetes. In deciding on the degree of hyperglycemia, we chose to remain below the renal threshold for glycosuria (∼10 mmol/L [180 mg/dL]) to minimize the risk of dehydration in the study participants due to osmotic diuresis. Likewise, in deciding on the degree of hyperinsulinemia, we picked an insulin infusion rate that would typically mimic circulating plasma insulin concentrations, derived from exogenously administered insulin, obtained in the postprandial state in individuals with type 1 diabetes. Individuals with type 1 diabetes typically refrain from exercising shortly after a bolus dose of insulin to minimize the risk of hypoglycemia and are usually recommended exercise by their health care providers either before their meal or at least 1–2 h after a meal. This precautionary measure avoids exposing the exercising muscles to the effects of higher circulating insulin concentrations arising shortly after a prandial bolus insulin dose, thus minimizing the risk for hypoglycemia during and after exercise.
We have shown that under those experimental conditions, although participants with type 1 diabetes were insulin resistant compared with their counterparts without diabetes throughout the study at every study visit, exercise-induced compensatory increase in EGP was intact and robust in type 1 diabetes participants at euglycemia and hyperglycemia. This is especially intriguing during hyperglycemia since hyperglycemia, per se, has an inhibitory effect on EGP via the mechanism of glucose effectiveness. Glucose effectiveness is defined as the ability of glucose in the presence of unchanging basal insulin concentrations to inhibit hepatic glucose production and stimulate whole-body glucose uptake. Our observation of robust and preserved exercise-induced EGP response during hyperglycemia and low and unchanging insulin concentrations implies a state of hepatic glucose resistance in participants with type 1 diabetes. This, in turn, could be a protective phenomenon against the development of hypoglycemia in these individuals. Furthermore, this finding is not dissimilar to our prior report (12), where exercise-induced increases in EGP remained vigorous in participants with type 1 diabetes in the postprandial state despite higher circulating glucose concentrations when compared with participants without diabetes.
In contrast to the lack of effects of hyperglycemia on suppression of EGP during exercise, modest hyperinsulinemia, derived from exogenously administered insulin, inhibited exercise-mediated increases in EGP in participants with type 1 diabetes such that the rates of EGP no longer differed from the participants without diabetes under the same experimental conditions. This observation is translationally relevant since a vigorous EGP response to exercise is a critical protective compensatory reaction that is essential to counteract the exercise-induced rapid rise in Rd to prevent hypoglycemia. Our findings suggest that even modest hyperinsulinemia within the physiological range can effectively abolish the protective exercise-induced EGP response in people with type 1 diabetes.
Our experimental design could not determine the effects of hyperglycemia, per se, on exercise-mediated changes to glucose fluxes in participants without diabetes. This was because when glucose concentrations were raised to the target hyperglycemia range during HyLoI, the normal β-cells responded with increasing insulin secretion resulting in combined hyperglycemia and hyperinsulinemia in participants without diabetes during this visit. This could have been prevented by conducting all of the experiments with a somatostatin pancreatic clamp, but that would have also precluded assessment of endogenous glucagon response to exercise during the study visits.
It is notable that circulating glucagon concentrations were comparable between both groups during all study visits especially during exercise. This was likely because biochemical hypoglycemia was prevented in all study visits with glucose infusions as part of the clamp studies. Furthermore, exercise-induced changes in circulating epinephrine and cortisol concentrations are also important factors that regulate glucose production. We did not measure these hormones in this pilot study. Future studies are needed where the role of these hormones on EGP (glycogenolysis and gluconeogenesis) and glucose uptake can be assessed.
Rates of glucose disappearance increased with exercise in both groups during all study visits. However, peak Rd remained lower in participants with type 1 diabetes than in those without diabetes during all study visits, implying that the insulin-resistant state that is inherent in participants with type 1 diabetes, though improved compared with the resting state, is not restored to that observed in participants without diabetes during an acute bout of moderate exercise. These results concur with our prior observations where both Rd and glucose clearance were significantly lower in participants with type 1 diabetes than in healthy participants during exercise in the postprandial state (12). In this study, we enrolled recreationally active participants who were not part of any physical training program and, therefore, had average levels of fitness as shown by their modest VO2max values. Prior reports have touted the benefits of exercise training on improving fitness and health in individuals with type 1 diabetes (1,3,24–26) and have also demonstrated insulin resistance and impaired glucose oxidation in exercising skeletal muscles in individuals with type 1 diabetes (27,28). However, additional studies are needed to determine whether this is true and, if so, the extent to which short- and long-term exercise training restores carbohydrate and energy metabolism in participants with type 1 diabetes.
We did not add a fourth study visit to test the combined effects of hyperglycemia and hyperinsulinemia since performing four study visits per subject would have significantly increased the experimental burden for the research participants. Furthermore, blood volume limitations did not permit more than ∼540 mL in any 12-week period for human subject safety reasons, hence the addition of another study visit to an already intensive experimental design would have prolonged the duration of the study by conducting the fourth visit after a gap of 12 weeks, which would have been harder to achieve in study particpants. Given the results of this study, one can speculate, however, that we would have likely observed further suppression of EGP coupled with incremental stimulation of Rd with the combined signals of hyperglycemia and hyperinsulinemia in participants with type 1 diabetes. This would have created an even greater unfavorable metabolic milieu for exercise in people with type 1 diabetes. These experiments were conducted with moderate-intensity exercise. Additional experiments are necessary to assess the effects of exercise at varying intensities (high versus moderate), duration (short sprint versus endurance) and types (aerobic versus anaerobic; interval versus continuous) on glucose fluxes in individuals with type 1 diabetes. Furthermore, the effects of training per se in those with type 1 diabetes (trained versus recreationally active; elite endurance athletes versus sprinters) are needed to better understand fuel metabolism so that rational informed management strategies can be developed to benefit the next generation of individuals with type 1 diabetes.
The clinically pertinent take-home message from this study is that moderate exercise in recreationally active people with type 1 diabetes is preferred when their blood glucose levels are normal or modestly elevated (<10 mmol/L) but not when their circulating insulin concentrations are raised (e.g., shortly after a bolus or prandial dose of insulin).
Article Information
Acknowledgments. The authors thank Barbara Norby, Brent McConahey, and Michael Slama (Endocrine Research Unit, Mayo Clinic) and the staff of the Mayo Clinic CRTU for their contributions in the conduct of the study.
Funding. This study was supported by National Institutes of Health National Institute of Diabetes and Digestive and Kidney Diseases grants R01-DK-90541 and R01-DK-29953 to R.B. and R01-DK-85516 and DP3-DK-106785 to A.B., by National Center for Advancing Translational Science grant UL1 TR000135, and by the Italian Minister for Education under the initiative “Departments of Excellence” (Law 232/2016).
Duality of Interest. No potential conflicts of interest relevant to this article were reported.
Author Contributions. D.R. assisted with the study, analyzed the data, and wrote the manuscript. K.O. helped in the conduct of the study. R.C. analyzed the data and edited the manuscript. C.C. helped in the design of the study, analyzed the data, and edited the manuscript. C.D.M. analyzed the data. A.B. and R.B. designed and conducted the studies, analyzed the data, and wrote the manuscript. R.B. is the guarantor of this work and, as such, had full access to all the data in the study and takes responsibility for the integrity of the data and the accuracy of the data analysis.
Prior Presentation. Parts of this study were presented in abstract form at the 78th Scientific Sessions of the American Diabetes Association, Orlando, FL, 22–26 June 2018.