


The aim of this study was to examine the association of circulating retinol-binding protein 4 (RBP4) levels with β-cell function across the spectrum of glucose tolerance from normal to overt type 2 diabetes.
A total of 291 subjects aged 35–60 years with normal glucose tolerance (NGT), newly diagnosed impaired fasting glucose or glucose tolerance (IFG/IGT), or type 2 diabetes were screened by a standard 2-h oral glucose tolerance test (OGTT) with the use of traditional measures to evaluate β-cell function. From these participants, 74 subjects were recruited for an oral minimal model test, and β-cell function was assessed with model-derived indices. Circulating RBP4 levels were measured by a commercially available ELISA kit.
Circulating RBP4 levels were significantly and inversely correlated with β-cell function indicated by the Stumvoll first-phase and second-phase insulin secretion indices, but not with HOMA of β-cell function, calculated from the 2-h OGTT in 291 subjects across the spectrum of glycemia. The inverse association was also observed in subjects involved in the oral minimal model test with β-cell function assessed by both direct measures and model-derived measures, after adjustment for potential confounders. Moreover, RBP4 emerged as an independent factor of the disposition index-total insulin secretion.
Circulating RBP4 levels are inversely and independently correlated with β-cell function across the spectrum of glycemia, providing another possible explanation of the linkage between RBP4 and the pathogenesis of type 2 diabetes.
Introduction
Retinol-binding protein 4 (RBP4), a 21-kDa protein that belongs to the lipocalin family, is primarily known as the principal retinol transporter in plasma. It is encoded by the RBP4 gene that maps to chromosome 10q23-q24, a region that has been shown to be associated with an increased risk of type 2 diabetes (1,2). Controversy still exists about the origin of the increased circulating RBP4 levels. RBP4 was originally recognized as an adipokine, with adipocytes being the main source expressing a considerable amount of RBP4 (3). In contrast, other studies identified RBP4 as a hepatokine, with hepatocytes being the major site for the synthesis and secretion of the circulating RBP4 (4,5). Cross-sectional studies reported that circulating RBP4 levels were significantly elevated in both obese and diabetic murine models and in patients (6,7). In addition, genetic studies support the inductive role for RBP4 in causing type 2 diabetes as a gain-of-function human nucleotide polymorphism in the RBP4 promoter correlated with the increased risk of type 2 diabetes (8). Further prospective cohort studies confirmed the predictive value of circulating RBP4 for incident type 2 diabetes in high-risk populations (9,10).
Type 2 diabetes is characterized by insulin resistance and pancreatic β-cell dysfunction. Previous studies found that genetic or pharmacologic elevation of RBP4 levels in mice resulted in the development of insulin resistance, whereas lowering RBP4 levels markedly improved insulin sensitivity (11,12). However, these associations are not supported by all studies in humans, as several studies found no correlation between circulating RBP4 levels and insulin resistance in type 2 diabetes (13–16). This discrepancy suggests a limited understanding of the relationship between RBP4 and the pathogenesis of type 2 diabetes. Although insulin resistance is recognized as the major pathophysiological feature of type 2 diabetes, pancreatic β-cell dysfunction seems to be predominant for the transition from specific metabolic dysfunctional status to type 2 diabetes (17–19). However, little is currently known about the association of RBP4 levels with pancreatic β-cell function.
To gain a better understanding of the pathophysiological actions of RBP4 in the development of type 2 diabetes, we evaluated the potential relationship between serum RBP4 levels and β-cell function in subjects across glycemic statuses from normal glucose tolerance to overt diabetes by using both traditional measures and the oral minimal model–derived indices to evaluate β-cell function.
Research Design and Methods
Study Design and Participant Recruitment
The study subjects were recruited between July 2018 and November 2018 via posters and advertisements in local and social media at the Community Health Service Center in Dongguan City, Guangdong Province, China. Subjects were invited to participate in a screening examination for diabetes by the 2-h standard oral glucose tolerance test (OGTT), which was conducted under overnight fasting conditions with blood sampling at 0 and 120 min after oral loading of 75 g glucose. Subjects with type 2 diabetes were defined as having a fasting blood glucose level (FBG) of ≥7.0 mmol/L (126 mg/dL) or 2-h glucose level ≥11.1 mmol/L (200 mg/dL) during the OGTT, impaired fasting glucose (IFG) as having an FBG level of 5.6–6.9 mmol/L (100–125 mg/dL), and impaired glucose tolerance (IGT) as having a 2-h glucose level of 7.8–11.0 mmol/L (140–199 mg/dL) according to the American Diabetes Association guidelines from 2010 (20).
The inclusion criteria of the study subjects were local residents aged between 35 and 60 years old with stable body weight (change less than ±10% of current body weight) for 3 months before the study. Exclusion criteria were known diagnosed diabetes, benign or malignant tumor, acute or chronic liver diseases, history of cardiovascular and cerebrovascular diseases, regular therapy with antihypertensive drug, hypolipidemic agents, hormonal agents, or antidepressants within 3 months, and women during pregnancy or lactation.
After anthropometric measurement, inquisition of detailed medical and clinic record, and 2-h standard OGTT, we finally recruited 291 subjects, including 105 NGT subjects, 115 IFG/IGT subjects, and 71 subjects with diabetes in the final analysis. Among these subjects, 74 (21 NGT, 26 IFG/IGT, and 27 with diabetes) volunteered to take part in the 3-h oral minimal model tests with sampling at 0, 10, 20, 30, 60, 90, 120, and 180 min after a 75-g oral glucose challenge (17,21). This study complied with the Declaration of Helsinki and was approved by the School of Public Health Institutional Review Board of Sun Yat-sen University. All subjects provided written informed consent before data collection.
Data Collection
A standardized questionnaire including general information on the examination date of demographic characteristics, physical activity, smoking habits, alcohol consumption, family history of diabetes, and medication history was conducted through a face-to-face interview. Smoking was defined as at least one cigarette per day for >6 months. Alcohol drinking was defined as drinking any type of alcoholic beverage at least once a week for >6 months. Age was determined to the nearest year, weight and height were determined to the nearest 0.1 kg and 0.1 cm, respectively, and resting blood pressure was measured with an aneroid sphygmomanometer on the upper arm using an appropriately sized cuff.
Clinical and Biochemical Measurements
Fasting lipids and liver enzymes and parameters of renal function in the circulation were performed in the Health Pathology Laboratory using an automated autoanalyzer (BC5180; Mindray). Plasma glucose and HbA1c were measured by the glucose oxidase method and anion-exchange high-performance liquid chromatography, respectively. The estimated glomerular filtration rate (eGFR) was calculated using the equation of the Chronic Kidney Disease Epidemiology Collaboration, which is based on age, sex, ethnicity, and serum creatinine concentrations (22). The secreted insulin and C-peptide levels during the tests were measured using commercial ELISA kits (intraassay coefficient of variation of <8%) (Mercodia, Uppsala, Sweden). Serum full-length RBP4 levels were measured with a commercial ELISA kit (AdipoGen, Seoul, Korea) according to the manufacturer’s instructions and compared with purified human RBP4 standards. The mean intraassay and interassay coefficients of variation were 1.363–11.41% and 2.419–13.85%, respectively.
Assessment of β-Cell Function
Direct Measurements
The traditional surrogates of insulin sensitivity and β-cell function were calculated from the OGTT data. Insulin sensitivity was evaluated by the HOMA of insulin resistance (HOMA-IR) index and the quantitative insulin sensitivity check index (QUICKI) model: 1/(log[Ins0] + log[Gluc0]) (23). β-Cell function was calculated by the HOMA of β-cell function (HOMA-β) and the Stumvoll formula including 1) the Stumvoll first-phase insulin secretion index: 2,032 + 4.681 × Ins0 − 135.0 × Gluc120 + 0.995 × Ins120 + 27.99 × BMI − 269.1 × Gluc0; and 2) the Stumvoll second-phase insulin secretion index: 277 + 0.800 × Ins0 − 42.79 × Gluc120 + 0.321 × Ins120 + 5.338 × BMI) (24). In addition to the above-mentioned measures, β-cell function was also calculated by the insulinogenic index (IGI) [(Ins30 − Ins0)/(Gluc30 − Gluc0)] and C-peptide index (CPI) [(Cpep30 − Cpep0)/(Gluc30 − Gluc0)] (17), in subjects involved in the oral minimal model tests.
Oral Minimal Model–Derived Measurements
In the oral minimal model method, insulin sensitivity was estimated using the insulin/glucose minimal model, while insulin secretion measures were derived from the glucose/C-peptide minimal model with SAAM II 2.3 software (The Epsilon Group, Charlottesville, VA), as previously discussed (21). Measured glucose, insulin, and C-peptide concentrations during the 3-h OGTT were used as the known inputs, and glucose derivatives were calculated using MATLAB R2016a software (MathWorks, Natick, MA) (17). The oral minimal models produced estimates for each participant of the SI (insulin sensitivity index), PhiD (dynamic insulin secretion, representing promptly releasable insulin secretion that is proportional to the increase rate of glucose concentration), PhiS (static insulin secretion: provision of new insulin to the releasable pool by a delay time constant), and PhiT (total insulin secretion, incorporating the PhiS and PhiD to calculate the overall β-cell responsivity index). The disposition indices (DIs) were then calculated by combining the modeled SI with modeled PhiS, PhiD, and PhiT (21,25).
Sample Size
The sample size calculation was based on an expected effect size reported previously (6) with 80% power at a 0.05 significance level, which indicated that it would require 39 participants (13 in each group). On the basis of the observed effect size, our sample size was adequate to achieve 99.99% power in the 2-h OGTT analysis and 83.72% power in the analysis of the oral minimal model test (α = 0.05).
Statistical Analysis
Statistical analyses were performed using SPSS 22.0 software. Normally distributed continuous variables are reported as the mean ± SD, and skewed variables are presented as medians (interquartile ranges). Normally distributed parameters were compared with ANOVA, followed by the least significant differences t test to further compare the data between two groups. Nonnormally distributed parameters were compared with the Kruskal-Wallis test, followed by the Nemenyi test to compare the data between two groups. Categorical variables are presented as frequencies (%) and were compared with the χ2 test. Nonnormally distributed parameters were log transformed before analysis, while the data are presented as nontransformed values for clarity.
RBP4 and oral minimal model–derived β-cell function indices were log transformed into normally distributed parameters before the associations were analyzed with the Pearson test. The associations between RBP4 and other β-cell function indices were analyzed with the Spearman test because these β-cell function indices were nonnormally distributed parameters before and after transformation.
Multivariate linear regression analysis was used to identify the variables independently associated with DI-PhiT. Potential confounding variables, including age, sex, BMI, waist-to-hip ratio (WHR), systolic blood pressure (SBP), diastolic blood pressure (DBP), triglyceride, total cholesterol (TC), and LDL cholesterol (LDL-c) were controlled in the regression models according to the disjunctive cause criterion (26). Multivariate linear regression analysis was performed in a stepwise manner.
Results
Association of Serum RBP4 Levels With β-Cell Function Assessed by 2-h OGTT
We first evaluated the relationship between serum RBP4 levels and β-cell function in subjects who underwent a 2-h OGTT. The basic characteristics of the subjects recruited are summarized in Supplementary Table 1. The different groups did not differ significantly in age, sex, smoking and alcohol exposure, physical activity, family history of type 2 diabetes, or eGFR. Participants with type 2 diabetes had higher DBP, alanine aminotransferase, AST, and triglyceride levels than IFG/IGT and NGT subjects. In IFG/IGT subjects, no significant decrease in HOMA-β was observed compared with NGT subjects. This was detected to be significantly deteriorated in patients with diabetes compared with NGT and IFG/IGT subjects. However, HOMA-IR, QUICKI, and the Stumvoll first-phase and second-phase insulin secretion indices all showed stepwise decreases across worsening clinical stages (NGT vs. IFG/IGT, NGT vs. type 2 diabetes, and IFG/IGT vs. type 2 diabetes, P < 0.05).
Higher circulating RBP4 concentrations were observed in the IFG/IGT group and were further aggravated in patients with type 2 diabetes (Fig. 1A). Serum RBP4 levels were positively associated with BMI, WHR, SBP, DBP, triglyceride, TC, and LDL-c (all P < 0.05) but negatively correlated with HDL cholesterol (HDL-c) levels (all P < 0.05). The associations with DBP, triglyceride, and HDL-c were still significant even after adjustment for sex, age, smoking, drinking, physical activity, and family history of type 2 diabetes (Supplementary Table 2).

Elevated circulating RBP4 levels inversely correlate with the Stumvoll insulin secretion indices in subjects across the spectrum of glycemia (n = 291). A: Circulating RBP4 levels according to glycemia status. Data are presented as the mean ± SEM. *P < 0.05. Spearman correlation between RBP4 levels and HOMA-β (B), Stumvoll first-phase insulin secretion index (C), and Stumvoll second-phase insulin secretion index (D) in subjects recruited in the 2-h OGTT.
Elevated circulating RBP4 levels inversely correlate with the Stumvoll insulin secretion indices in subjects across the spectrum of glycemia (n = 291). A: Circulating RBP4 levels according to glycemia status. Data are presented as the mean ± SEM. *P < 0.05. Spearman correlation between RBP4 levels and HOMA-β (B), Stumvoll first-phase insulin secretion index (C), and Stumvoll second-phase insulin secretion index (D) in subjects recruited in the 2-h OGTT.
We found that serum RBP4 levels were inversely correlated with insulin sensitivity as determined by HOMA-IR and QUICKI (Supplementary Table 3). Although we did not observe a significant association between RBP4 and HOMA-β (r = −0.047, P = 0.418) (Fig. 1B), we found that serum RBP4 was negatively associated with the Stumvoll first-phase (r = −0.275, P < 0.001) (Fig. 1C) and second-phase (r = −0.346, P < 0.001) (Fig. 1D) insulin secretion indices. The association still significantly persisted even after adjustment for age, sex, smoking, drinking, physical activity, and family history of type 2 diabetes plus DBP, triglyceride, and HDL-c (Supplementary Table 3). These results provide strong implications that the linkage between RBP4 and type 2 diabetes may occur not only through insulin resistance but also through β-cell dysfunction.
Association of Serum RBP4 Levels With β-Cell Function Assessed by the Oral Minimal Model Test
To better clarify the above association between RBP4 and β-cell function, we further assessed β-cell function by the oral minimal model test, a useful alternative deriving detailed phenotypes of β-cell function by quantitatively simulating the complex process of glucose metabolism in humans (17,21). Metabolic characteristics pertaining to insulin sensitivity and β-cell function were calculated from the plasma glucose (Supplementary Fig. 1A), insulin (Supplementary Fig. 1B), and C-peptide (Supplementary Fig. 1C) measures with the oral minimal model method. Model-derived SI showed stepwise decreases across worsening clinical stages (NGT vs. IFG/IGT, NGT vs. type 2 diabetes, and IFG/IGT vs. type 2 diabetes, P < 0.001) (Table 1). Model-derived PhiD was lower in each successive clinical stage (NGT vs. IFG/IGT, P = 0.022; NGT vs. type 2 diabetes, P < 0.001; IFG/IGT vs. type 2 diabetes, P < 0.001). PhiS and PhiT were impaired in those with type 2 diabetes compared with NGT and IFG/IGT subjects, with no significant difference observed between individuals with NGT and IFG/IGT (NGT vs. IFG/IGT, P > 0.05; NGT vs. type 2 diabetes, P < 0.001; IFG/IGT vs. type 2 diabetes, P < 0.001) (Table 1).
Metabolic characteristics and indices of insulin sensitivity and β-cell function of subjects assessed by oral minimal model test (n = 74)
| Characteristics | NGT | IFG/IGT | Type 2 diabetes | P value | P (NGT vs. IFG/IGT) | P (NGT vs. type 2 diabetes) | P (IFG/IGT vs. type 2 diabetes) |
|---|---|---|---|---|---|---|---|
| Age (years) | 45.9 ± 7.78 | 47.41 ± 6.75 | 45.82 ± 6.23 | 0.650 | — | — | — |
| Sex, n (male/female) | 21 (11/10) | 26 (11/15) | 27 (16/11) | 0.464 | — | — | — |
| BMI (kg/m2) | 24.41 ± 3.25 | 24.05 ± 3.27 | 25.47 ± 2.19 | 0.440 | — | — | — |
| Family history, n (%) | 2 (7.69) | 2 (7.69) | 4 (14.81) | 0.233 | — | — | — |
| Current smoking, n (%) | 5 (20.83) | 2 (7.69) | 6 (22.22) | 0.184 | — | — | — |
| Physical activity, n (%) | 1 (4.77) | 2 (7.69) | 2 (7.40) | 0.160 | — | — | — |
| FBG (mmol/L) | 4.76 ± 0.32 | 5.15 ± 0.73 | 6.55 ± 1.54 | <0.001 | 0.229 | <0.001 | <0.001 |
| 2-h PBG (mmol/L) | 6.11 ± 1.19 | 8.66 ± 1.42 | 15.05 ± 3.16 | <0.001 | <0.001 | <0.001 | <0.001 |
| HbA1c (%) | 5.34 ± 1.1 | 5.57 ± 0.32 | 6.43 ± 1.18 | <0.001 | 0.742 | <0.001 | <0.001 |
| HbA1c (mmol/mol) | 36.08 ± 7.59 | 37.5 ± 3.63 | 46.7 ± 12.83 | <0.001 | 0.731 | <0.001 | <0.001 |
| Fasting insulin (mU/L) | 5.81 ± 2.84 | 5.71 ± 2.69 | 7.81 ± 4.19 | 0.225 | 0.216 | 0.748 | 0.094 |
| WHR | 0.88 ± 0.05 | 0.87 ± 0.06 | 0.91 ± 0.06 | 0.032 | 0.954 | 0.031 | 0.02 |
| Body fat (%) | 27.78 ± 5.42 | 28.11 ± 7.88 | 27.84 ± 7 | 0.825 | — | — | — |
| SBP (mmHg) | 122.62 ± 14.09 | 122.45 ± 14.55 | 131.14 ± 18.93 | 0.135 | — | — | — |
| DBP (mmHg) | 81.76 ± 10.25 | 81.36 ± 8.67 | 87.71 ± 12.21 | 0.093 | — | — | — |
| ALT (units/L) | 27.01 ± 12.02 | 23.78 ± 10.1 | 44.65 ± 28.16 | 0.010 | 0.858 | 0.009 | 0.01 |
| AST (units/L) | 24.31 ± 3.75 | 22.21 ± 6.54 | 29.46 ± 15.39 | 0.127 | — | — | — |
| TC (mmol/L) | 5.17 ± 1.08 | 5.49 ± 0.63 | 5.82 ± 1.11 | 0.085 | — | — | — |
| Triglyceride (mmol/L) | 1.77 ± 1.16 | 1.57 ± 0.72 | 2.98 ± 1.92 | 0.001 | 0.631 | 0.002 | <0.001 |
| HDL-c (mmol/L) | 1.22 ± 0.35 | 1.35 ± 0.27 | 1.27 ± 0.35 | 0.170 | — | — | — |
| LDL-c (mmol/L) | 2.99 ± 0.77 | 3.23 ± 0.51 | 3.28 ± 0.86 | 0.177 | — | — | — |
| eGFR (mL/min/1.73 m2) | 88.72 ± 15.24 | 94.33 ± 17.89 | 93.11 ± 17.96 | 0.561 | — | — | — |
| RBP4 (μg/mL) | 30.20 [27.68–39.78] | 42.11 [35.5–56.43] | 49.28 [38.85–55.72] | 0.006 | 0.012 | 0.002 | 0.533 |
| HOMA-IR | 1.25 [0.68–1.98] | 1.33 [0.88–1.89] | 1.64 [1.3–2.94] | 0.008 | 0.89 | 0.033 | 0.018 |
| QUICKI | 0.36 [0.34–0.40] | 0.37 [0.35–0.40] | 0.35[0.33–0.37] | 0.008 | 0.89 | 0.033 | 0.018 |
| HOMA-β | 97.24 [64.80–136.25] | 83.96 [42.35–125.57] | 51.65 [30.34–85.24] | 0.027 | 0.566 | 0.022 | 0.458 |
| Stumvoll insulin secretion | |||||||
| First-phase | 957.37 [725.76–1,421.97] | 440 [254.74–774.75] | −7.87 [–336.50 to 390.00] | <0.001 | 0.005 | <0.001 | 0.009 |
| Second-phase | 273.94 [207.10–376.28] | 142.28 [100.96–218.32] | 43.77 [–32.43 to 136.87] | <0.001 | 0.005 | <0.001 | 0.02 |
| IGI (pmol/mmol) | 83.33 [63.90–112.67] | 41.1 [30.39–73.84] | 22.21 [10.37–43.05] | <0.001 | 0.013 | <0.001 | 0.026 |
| CPI (nmol/mmol) | 0.35 [0.27–0.41] | 0.21 [0.18–0.30] | 0.13 [0.06–0.19] | <0.001 | 0.045 | <0.001 | 0.002 |
| Model-derived measures | |||||||
| SI (10−4 dL/kg/min per μU/min) | 19.89 [10.21–32.32] | 10.90 [4.92–16.63] | 1.28 [1.21–3.42] | <0.001 | <0.001 | <0.001 | <0.001 |
| PhiD × 10−9 | 734.53 [509.54–913.02] | 464.62 [353.37–601.91] | 260.03 [144.96–349.31] | <0.001 | 0.022 | <0.001 | <0.001 |
| PhiS × 10−9/min | 45.06 [37.63–63.99] | 39.03 [30.25–62.23] | 23.29 [14.14–32.51] | <0.001 | 0.197 | <0.001 | <0.001 |
| PhiT × 10−9/min | 56.25 [46.04–83.22] | 49.40 [34.89–84.23] | 27.53 [14.81–38.61] | <0.001 | 0.411 | <0.001 | <0.001 |
Data of demographic and metabolic characteristics of subjects at each clinical stage are presented as means ± SD, unless otherwise indicated. RBP4 levels and indices of insulin sensitivity and β-cell function are expressed as the median [interquartile range], where the interquartile range values are indicated as 25th percentile–75th percentile. SI, PhiD, PhiS, and PhiT were derived from oral minimal model test. PBG, postprandial blood glucose.
RBP4 concentrations were higher in the patients with IFG/IGT and type 2 diabetes (Fig. 2A). Serum RBP4 levels were inversely and significantly correlated with β-cell function calculated from direct measurements: Stumvoll first-phase insulin secretion index (r = −0.277, P = 0.015) (Fig. 2B), Stumvoll second-phase insulin secretion index (r = −0.261, P = 0.023) (Fig. 2C), IGI (r = −0.263, P = 0.024) (Fig. 2D), and CPI (r = −0.257, P = 0.027) (Fig. 2E); and from the oral minimal model tests: PhiS (r = −0.303, P = 0.009) (Fig. 2F), PhiD (r = −0.332, P = 0.005) (Fig. 2G), and PhiT (r = −0.355, P = 0.002) (Fig. 2H). The significant inverse associations between RBP4 and the Stumvoll first-phase and second-phase insulin secretion index, IGI, and model-derived indices were independent of the potential covariates (Supplementary Table 4).
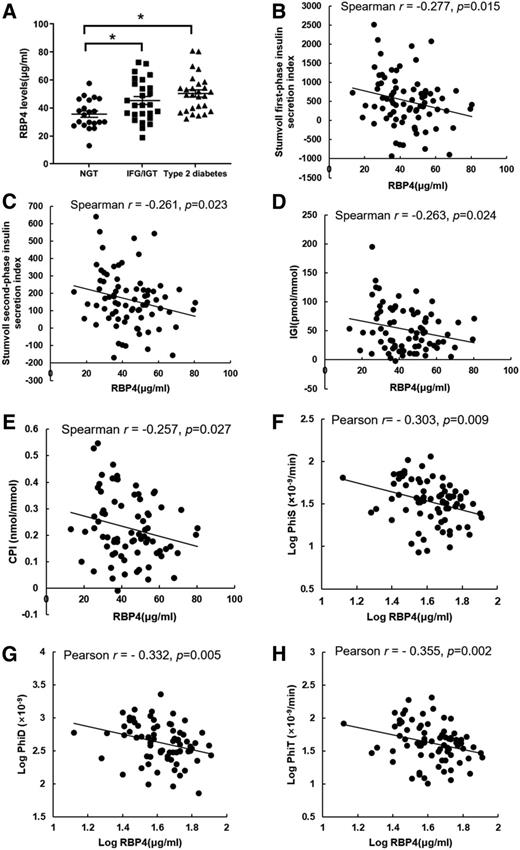
Elevated circulating RBP4 levels inversely correlate with β-cell function measures derived from the oral minimal model tests in subjects across the spectrum of glycemia (n = 74). A: Circulating RBP4 levels of subjects at each clinical stage recruited in the oral minimal model test. Data are presented as the mean ± SEM. *P < 0.05. The Spearman correlation between RBP4 levels and Stumvoll first-phase insulin secretion index (B), Stumvoll second-phase insulin secretion index (C), IGI (D), and CPI (E). The Pearson correlation between RBP4 levels and PhiS (F), PhiD (G), and PhiT (H). RBP4, PhiS, PhiD, and PhiT were log transformed into normally distributed parameters before the Pearson correlation analysis.
Elevated circulating RBP4 levels inversely correlate with β-cell function measures derived from the oral minimal model tests in subjects across the spectrum of glycemia (n = 74). A: Circulating RBP4 levels of subjects at each clinical stage recruited in the oral minimal model test. Data are presented as the mean ± SEM. *P < 0.05. The Spearman correlation between RBP4 levels and Stumvoll first-phase insulin secretion index (B), Stumvoll second-phase insulin secretion index (C), IGI (D), and CPI (E). The Pearson correlation between RBP4 levels and PhiS (F), PhiD (G), and PhiT (H). RBP4, PhiS, PhiD, and PhiT were log transformed into normally distributed parameters before the Pearson correlation analysis.
Association of Serum RBP4 Levels With the DIs From the Oral Minimal Model Test
The magnitude of insulin secretion is known to be compensatorily enhanced by the ambient insulin resistance in the progression of type 2 diabetes, while the interdependence is captured by the DIs, which distinguishes insufficient compensation from appropriate insulin secretion (17,27). To better clarify the independent role of RBP4 on β-cell function in the context of insulin resistance, we further evaluated the associations between RBP4 and model-derived DIs. The DIs calculated from model-derived indices showed differences across glycemic stages (DI-PhiD: NGT vs. IFG/IGT, P = 0.018; NGT vs. type 2 diabetes, P < 0.001; IFG/IGT vs. type 2 diabetes, P < 0.001) (DI-PhiS and DI-PhiT: NGT vs. IFG/IGT, P > 0.05; NGT vs. type 2 diabetes, P < 0.001; and IFG/IGT vs. type 2 diabetes, P < 0.001) (Supplementary Table 5). RBP4 was inversely associated with DI-PhiD, DI-PhiS, and DI-PhiT, respectively, even after adjustment for age, sex, smoking, drinking, physical activity, and family history of type 2 diabetes (Supplementary Table 6), suggesting this association was independent of insulin sensitivity.
To further identify independent determinants of β-cell function with adjustment of the degree of insulin resistance, forward stepwise multivariate linear regression analysis showed the serum RBP4 was an independent and negative determinant of DI-PhiT after adjustment for the potential covariates including age, sex, BMI, WHR, SBP, DBP, triglyceride, TC, and LDL-c (Table 2).
Multivariate linear regression analysis with DI-PhiT as a dependent variable (n = 74)
| Unstandardized coefficients | Standardized coefficients | t | P | ||
|---|---|---|---|---|---|
| β | SE | β | |||
| Independent variables (constant) | 1,475.40 | 254.67 | — | 5.79 | 0.000 |
| Age | — | — | 0.19 | 1.72 | 0.089 |
| Sex | — | — | 0.04 | 0.36 | 0.721 |
| BMI | — | — | −0.19 | −1.71 | 0.092 |
| WHR | — | — | −0.09 | −0.68 | 0.502 |
| SBP | — | — | −0.08 | −0.70 | 0.486 |
| DBP | — | — | −0.09 | −0.82 | 0.419 |
| TC | — | — | −0.03 | −0.21 | 0.832 |
| LDL-c | — | — | −0.03 | −0.24 | 0.808 |
| Triglyceride | −116.42 | 51.75 | −0.25 | −2.25 | 0.028 |
| RBP4 | −13.03 | 5.61 | −0.24 | −2.32 | 0.023 |
Multivariate linear regression analysis was performed in a stepwise manner with potential variables including age, sex, BMI, WHR, SBP, DBP, triglyceride, TC, and LDL-c.
Conclusions
In the present cross-sectional study of subjects with NGT, IFG/IGT, and drug-naive, newly diagnosed type 2 diabetes, we demonstrated that circulating RBP4 levels were inversely associated with pancreatic β-cell function across the spectrum of glycemia. These associations remained significant even after controlling for known diabetes risk factors such as age, sex, smoking, drinking, physical activity, and family history of type 2 diabetes. Despite the well-known biological actions of RBP4 in insulin resistance and diabetes, to the best of our knowledge, this is the first study to investigate the association between RBP4 and β-cell function in subjects across the spectrum of glycemia. Our findings provide novel mechanistic insight into the current understanding of RBP4 in the pathogenesis of type 2 diabetes.
Several human studies have explored the possible relationship between circulating RBP4 and β-cell function. Serum RBP4 was reported to be negatively associated with insulin secretion, assessed by the insulin area of the first 10 min of an intravenous glucose tolerance test (IVGTT) in 107 Spanish male subjects without diabetes. Moreover, they also showed the inverse relationship between RBP4 and the DI, an integrated measure of β-cell insulin secretory rates in the context of insulin resistance, in obese individuals (28). Additionally, serum RBP4 levels were negatively associated with β-cell function, evaluated by HOMA-β and further verified by hyperglycemic clamp in female patients with nonalcoholic fatty liver disease. But this phenomenon was not observed in male patients (29). On the contrary, in a subgroup of 296 nonvisceral obese NGT Chinese subjects, serum RBP4 was documented to be positively correlated with glucose-stimulated insulin secretion, assessed by ΔI30/ΔG30 (increment in plasma insulin and glucose concentration 30 min after OGTT) and the total area under the curve for insulin over 180 min, respectively, whereas this association was not found in NGT subjects with visceral obesity and subjects with type 2 diabetes (30). Furthermore, no correlation was found between RBP4 and β-cell function estimated by the DI calculated from an IVGTT in both young and elderly twins (31) and measured by mean insulin levels from the IVGTT and OGTT in a group of 75 obese Caucasians without diabetes (32).
The apparent controversy in these studies was due to several reasons. The relationship between RBP4 and β-cell function may be impeded by the pathophysiological statuses, such as obesity and nonalcoholic fatty liver disease, thus yielding conflicting findings. In addition, no reports to date have paid attention to the association in subjects across the glycemia stages from NGT to overt diabetes to elucidate the role of RBP4 in the progression of type 2 diabetes. More importantly, the methods used for the assessment of β-cell function were different. In most of these studies, β-cell function was evaluated by HOMA-β, mean insulin levels, or area under the curve for insulin from intravenous glucose-loading tests, which bypass the critical effect of intestine-derived incretin hormone on insulin secretion and are entirely nonphysiological (33).
In the current study, we evaluated β-cell function with both 2-h OGTT-derived indices and estimates derived from the oral minimal model test, which quantitatively simulates the complex process of glucose metabolism with a mathematical model and analogs β-cell responsibility. To exclude the potential influence of diabetes duration, antidiabetes drug use, and weight loss surgery/diet on circulating RBP4 levels (34–36), we recruited newly diagnosed and medication-naive IFG/IGT subjects and patients with type 2 diabetes with stable body weight in the last 3 months for the analysis. Consistent with previous studies in obese men without diabetes (28), we found an inverse association between RBP4 and the DI derived from the oral minimal model test even after adjusting for confounding factors in subjects across the spectrum of glycemia. Circulating RBP4 levels also emerged as an independent predictor of the DI-PhiT in multivariate linear regression analysis, suggesting that RBP4 might be a negative regulator of β-cell function. The underlying mechanism may be attributed to the direct inhibition role of RBP4 on glucose-induced insulin secretion in primary isolated mouse islets as well as the β-cell line (R.H., L.Z., unpublished data).
We did not find an association between RBP4 and HOMA-β in subjects across the spectrum of glycemia in the current study. Instead, we found that RBP4 was significantly inversely associated with the β-cell function indices derived from the glucose challenge, including the Stumvoll indices, IGI, and CPI, an index calculated from the concentrations of C-peptide, which is cosecreted with insulin in equimolar amounts and is entirely cleared at a relatively constant rate in peripheral tissues without hepatic degradation, providing a more accurate estimate of true β-cell insulin secretory rates (33). The discrepancy may be attributed to the fact that the indices upon glucose stimulation are more sensitive for probing the inadequate β-cell responsiveness, while HOMA-β is an estimate that only takes into account fasting/basal plasma glucose and insulin concentrations and has a relatively low precision to predict β-cell function (33).
Interestingly, we also observed that the circulating triglyceride level emerged as an independent predictor of β-cell function in multivariate linear regression analysis. Increased circulating triglyceride levels and pancreatic triglyceride contents have been demonstrated to be associated with β-cell dysfunction and incident type 2 diabetes in a high-risk population (37,38). Interventions that reduce circulating or pancreatic triglyceride contents could effectively restore insulin secretion (18,39,40).
Our study has several noteworthy strengths. First, this association was confirmed in two subgroups of subjects, which increased the strengths of the current findings and may provide a reasonably accurate and unbiased estimate of the relationship. The second strength of the study is the application of several methodologies to evaluate β-cell function more accurately, such as the Stumvoll indices, IGI, CPI, and oral minimal model test–derived indices. Furthermore, the biochemical assays were performed in a central laboratory to minimize potential bias.
Several potential limitations should be acknowledged. The causal relationship between RBP4 and β-cell function cannot be inferred by the cross-sectional design. Moreover, the relatively small sample size did not allow for generalization of our findings to other ethnicities. Nevertheless, our study added to the emerging literature indicating that elevated circulating RBP4 may adversely affect β-cell function. The dynamic association between RBP4 and β-cell function in the course of type 2 diabetes needs to be further verified in large-scale prospective cohort studies.
In conclusion, our results identified a negative association between RBP4 and β-cell function in individuals across the glycemia spectrum and shed new light on the role of RBP4 in the development of type 2 diabetes.
S.Y. is currently affiliated with the Clinical Nutrition Department, The Third People’s Hospital of Shenzhen, Shenzhen, Guangdong, People’s Republic of China.
This article contains Supplementary Data online at https://doi.org/10.2337/dc20-1234/suppl.11985918.
Article Information
Acknowledgments. The authors gratefully acknowledge the support of the study participants, study staff, and partner organizations participating in this study.
Funding. This work was supported by the “100 Top Talents Program” of Sun Yat-sen University to L.Z. and the Science and Technology Program of Guangzhou (20190401343) to L.Z and by the Fundamental Research Funds for the Central Universities to M.X.
Duality of Interest. No potential conflicts of interest relevant to this article were reported.
Author Contributions. R.H. conducted the case-control study and analyzed the data. S.Y., Y.Y., S.L., and N.C. provided support in recruiting subjects. R.H., M. X., and L.Z. designed the research and wrote, reviewed, and edited the manuscript. M.X. and L.Z. are the guarantors of this work and, as such, had full access to all the data in the study and take responsibility for the integrity of the data and the accuracy of the data analysis.