


Immunohistological analyses of pancreata from patients with type 1 diabetes suggest distinct autoimmune islet β-cell pathology between those diagnosed at <7 years (<7 group) and those diagnosed at age ≥13 years (≥13 group), with both B- and T-lymphocyte islet inflammation common in children in the <7 group, whereas B cells are rare in the ≥13 group. Based on these observations, we sought to identify differences in genetic susceptibility between these prespecified age-at-diagnosis groups to inform on the etiology of the most aggressive form of type 1 diabetes that initiates in the first years of life.
Using multinomial logistic regression models, we tested if known type 1 diabetes loci (17 within the HLA and 55 non-HLA loci) had significantly stronger effect sizes in the <7 group compared with the ≥13 group, using genotype data from 27,071 individuals (18,485 control subjects and 3,121 case subjects diagnosed at <7 years, 3,757 at 7–13 years, and 1,708 at ≥13 years).
Six HLA haplotypes/classical alleles and six non-HLA regions, one of which functions specifically in β-cells (GLIS3) and the other five likely affecting key T-cell (IL2RA, IL10, IKZF3, and THEMIS), thymus (THEMIS), and B-cell development/functions (IKZF3 and IL10) or in both immune and β-cells (CTSH), showed evidence for stronger effects in the <7 group.
A subset of type 1 diabetes–associated variants are more prevalent in children diagnosed under the age of 7 years and are near candidate genes that act in both pancreatic β- and immune cells.
Introduction
Type 1 diabetes is a multifactorial disease in which the insulin-producing β-cells of pancreatic islets are destroyed or rendered dysfunctional by an autoimmune process that often initiates in the first few months of life, causing a prediabetic, nonsymptomatic state in up to 0.4% of children (1). However, the actual diagnosis often happens many years after this prodromal phase, the joint environmental and genetic mechanisms of which remain ill defined, with the median age at diagnosis being around age 11 years. Even after diagnosis, there often remains sufficient endogenous insulin production to lower the requisite levels of insulin treatment and reduce the probability of developing complications later in life (2). The exceptions to this are the children diagnosed under age 5 years, in whom it is generally believed there is little insulin production shortly after diagnosis (2,3). This subgroup represents the largest unmet clinical challenge, because they suffer the greatest complications of the disease (3). Yet any intervention of type 1 diabetes autoimmunity in these young children must be as safe and precise as possible, targeting and modulating the causative molecules, cells, and pathways. Hence, we need to identify the specific mechanisms underlying early-diagnosed type 1 diabetes.
Recent evidence suggests that children diagnosed under 7 years of age may have a different, more aggressive form of islet inflammation (insulitis), characterized by a B-lymphocyte infiltrate coincident with a T-cell insulitis (CD4+ and CD8+ T cells), compared with children aged 13 years and above, who have a reduced B-cell presence (4). In case subjects diagnosed between 7 and 12 years, there is a mixture of islet infiltrate phenotypes, some with the “under 7” B-cell infiltrate and others with the “13 and over” phenotype.
There is already evidence that autoantigen-presenting genes HLA class II and class I are associated with reduced age at diagnosis, which provides insight into the biology of this most β-cell–destructive form of the disease (5–8). More recently, a genome-wide association analysis of age at diagnosis of type 1 diabetes identified a locus on chromosome 6q22.33 that acts almost exclusively in case subjects with type 1 diabetes diagnosed under age 5 years (9), encoding the protein tyrosine phosphatase receptor κ (PTPRK) and the thymocyte-expressed molecule involved in selection (THEMIS) genes. However, this approach had to apply a stringent genome-wide multiple testing correction criterion (P < 5 × 10⁻⁸), and informative, true signals were likely to have been missed. In the current study, we only analyzed the association of specified known type 1 diabetes risk regions, thereby reducing the multiple testing burden. In addition, we used the existing knowledge of differences in pancreatic immune cell infiltrates between those diagnosed at <7 years compared with ≥13 years to stratify patients according to their age at diagnosis and examine genetic differences between these groups of individuals, as opposed to treating age at diagnosis as a continuous phenotype.
If type 1 diabetes has a particular pancreatic immunophenotype, then it might be expected that it has distinct genetic features, characterized by susceptibility genes with larger effects in the group diagnosed at younger than 7 years. Moreover, the intermediate group, age at diagnosis 7–13 years, would have a risk for these age at diagnosis–sensitive genes lying between those under 7 years and those 13 and over.
Research Design and Methods
Study Populations
Our data set consisted of 18,485 control subjects and 3,121 case subjects with type 1 diabetes diagnosed at <7 years (<7 group), 3,757 at ≥7 to <13 years (7–13 group), and 1,708 at ≥13 years (≥13 group). The majority of individuals were from the U.K. (Table 1), although individuals recruited from countries with different ancestries were also included (Supplementary Fig. 1). Related individuals were removed from the analysis (Supplementary Approaches).
Characteristics of individuals included in the analysis
| Control subjects | Individuals with T1D diagnosed at <7 years | Individuals with T1D diagnosed at 7–13 years | Individuals with T1D diagnosed at ≥13 years | |
|---|---|---|---|---|
| n | 18,485 | 3,121 | 3,757 | 1,708 |
| Age at diagnosis (years), median (IQR) [range] | NA | 4 (2, 5) [0, 6.9] | 10 (8, 11) [7, 12.9] | 15 (13, 21) [13, 50.3] |
| Sex (female) | 9,771 (52.9) | 1,528 (49.0) | 1,968 (52.4) | 743 (43.5) |
| Asia-Pacific | 925 (5) | 28 (0.9) | 26 (0.7) | 52 (3.0) |
| Central Europe | 1,681 (9.1) | 52 (1.7) | 63 (1.7) | 156 (9.1) |
| Finland | 2,824 (15.3) | 100 (3.2) | 152 (4.0) | 434 (25.4) |
| Northern Ireland | 478 (2.6) | 222 (7.1) | 248 (6.6) | 35 (2.0) |
| U.K. | 10,593 (57.3) | 2,662 (85.3) | 3,206 (85.3) | 923 (54) |
| U.S. | 1,984 (10.7) | 57 (1.8) | 62 (1.7) | 108 (6.3) |
Data are presented as n (%), unless otherwise noted. IQR, interquartile range; T1D, type 1 diabetes.
The majority of case subjects in the ≥13 group were diagnosed before the typical age at type 2 diabetes diagnosis (∼45 years), with 68% diagnosed at ≤18 years and 99.9% diagnosed at ≤45 years. To further increase confidence that none of the case subjects in the oldest age-at-diagnosis group were individuals with type 2 diabetes, we took all index variants associated with type 2 diabetes (10) that were also present on the ImmunoChip (n = 30) and built a genetic risk score (GRS) to compare the mean score across all groups included in the analysis (Supplementary Approaches). The mean type 2 diabetes GRS was similar between all groups (control subjects = 2.47, <7 group = 2.49, 7–13 group = 2.48, and ≥13 group = 2.47), and there were no individuals in the ≥13 group with a type 2 diabetes GRS above that of the highest value among control subjects (3.47).
Loci Studied
We examined eight HLA class II haplotypes and nine HLA class I classical alleles for their association with type 1 diabetes diagnosed within each age-group, which were a subset of the most type 1 diabetes–associated haplotypes identified to date (11) that we also found to be associated with type 1 diabetes in our analysis after conditioning on the other associated HLA haplotypes (logistic regression Wald test P < 0.01). Supplementary Table 1 summarizes which haplotypes and classical alleles were examined, how they were defined, and whether they were common enough to include in our analysis, defined as having at least five individuals from each group carrying the classical allele/haplotype.
We also examined 55 loci outside the HLA that have previously shown association with type 1 diabetes either in univariable analyses or via fine mapping (Supplementary Table 2). Each locus contains an “index” variant, chosen to be the most strongly disease associated from a set of variants in linkage disequilibrium (LD) that constitute a single genetic signal. We allocated locus names to each of these variants based on a candidate gene(s), but the named genes may not be causal for type 1 diabetes.
Imputation
To impute classical HLA alleles, the HiBag (12) R Bioconductor package was used with the classifiers as calculated from the training data set in the original publication. Alleles called with a probability <0.5 were treated as missing. Some individuals were genotyped for a subset of their classical HLA alleles (8), so accuracy of imputation was assessed for a proportion of individuals.
When variants of interest failed genotype quality control (Supplementary Approaches), we imputed those variants plus 0.5 Mb of surrounding regions using the IMPUTE2 (13) software, with the 1000 Genomes Project data as the reference haplotypes. We used this same imputation strategy to impute around index variants for fine mapping non-HLA regions found to be differentially associated between the <7 and ≥13 groups.
Identifying Loci With Larger Effects in the <7 Compared With the ≥13 Group
To examine heterogeneity in effect size between age-at-diagnosis groups, we used a method analogous to performing three case-control analyses, comparing the prevalence of the allele under consideration in control subjects to the <7 group, 7–13 group, and ≥13 group, respectively, estimating an effect size for each group. The difference in the estimated effect size of the genetic variant between the first and third groups was used to determine the level of evidence (P value) for heterogeneity in the effect size of the variant between the youngest and oldest age-at-diagnosis groups, and the effect size in the second group (7–13) provided additional supporting evidence. More precisely, we fitted two multinomial logistic regressions per locus, one allowing for different effect sizes for the genetic variant at that locus in the <7 and ≥13 groups and the other constraining the effect size for the genetic variant in the <7 and ≥13 groups to equal each other. We compared the likelihoods of these models using a likelihood ratio test (14), and if the model allowing different effect sizes fit the data better than the model constraining the effect sizes to equal each other, the locus was considered heterogeneous in effect size between age-at-diagnosis groups. Both models included as covariates sex and the 10 largest principal components derived from the set of ImmunoChip variants passing quality control filters (Supplementary Approaches). This analysis was performed using the multinomRob R package (15).
For HLA loci, we additionally adjusted for other HLA haplotypes/alleles to account for the high levels of LD in the region. When examining the HLA class II haplotype effects other than DR3-DQ2/DR4-DQ8, we examined only individuals without the DR3-DQ2/DR4-DQ8 diplotype to remove any confounding effects of this diplotype. Supplementary Table 1 shows which individuals were included in each analysis and which classical haplotypes/alleles were adjusted for in each analysis.
Sensitivity Analyses: Non-HLA Results
To exclude the possibility of spurious associations due to population structure in our data, we repeated the analysis using only individuals from the U.K. and Northern Ireland and adjusted for sex and the five largest genetic principal components in these individuals only. Additionally, to test the sensitivity of our results to age-strata thresholds, we performed the same analysis but instead compared individuals diagnosed at <6 years to the ≥13 group and also individuals diagnosed at <5 years compared with the ≥13 group.
We declared a locus differentially associated if the heterogeneity P value was associated with a false discovery rate (FDR) of <0.1 (Supplementary Approaches). To explore whether there were more age at diagnosis–associated variants that we could not detect in the present analysis due to a lack of statistical power, we examined all loci that did not reach the association threshold (FDR <0.1) and counted how many loci had the largest effect in the <7 group, the intermediate effect in the 7–13 group, and the smallest effect in the ≥13 group and compared this to the expected frequency of this ordering using a binomial test (Supplementary Approaches).
Fine Mapping and Colocalization Analyses
For the non-HLA loci with the evidence of heterogeneity in effect size between age-at-diagnosis groups (FDR <0.1), we fine mapped a 0.5-Mb region around the index variant to identify potentially causal variants for type 1 diabetes diagnosed at <7 years. Analysis was limited to individuals from the U.K. and Northern Ireland, amounting to 2,884 case subjects diagnosed at <7 years and 11,071 control subjects, in order to examine a relatively homogeneous population, as fine mapping is sensitive to differences in LD structure between ancestrally divergent groups. We used GUESSFM (16), which performs a Bayesian variable selection stochastic search to identify the combinations of variants constituting separate genetic susceptibility to type 1 diabetes.
For those fine-mapped regions with high (>0.8) posterior probability of a single causal variant in the region, we conducted colocalization analyses with expression quantitative trait loci (eQTL) associations in whole blood from a data set of >30,000 individuals (17). This enabled us to estimate which genes the most likely causal variants are regulating and what direction the effects are on gene transcription and disease risk. The coloc R package was used to perform this analysis (18) (Supplementary Approaches).
Heritability Estimates by Age-at-Diagnosis Group
To estimate how the proportion of phenotypic variance could be explained by all variants on the ImmunoChip in each age-at-diagnosis group, we compared chip heritability estimates between case subjects with type 1 diabetes diagnosed at <7 years to those diagnosed at 7–13 years or ≥13 years. We used the GCTA software (https://cnsgenomics.com/software/gcta/#Overview) to fit linear mixed models and estimate heritability for each age-at-diagnosis group with a shared set of control subjects. We estimated heritability (hg2) on the liability scale, as derived in Lee et al. (19). We adjusted for sex and the 10 largest genetic principal components and included individuals from all ancestry backgrounds in the analysis. We repeated the analysis but excluded the entirety of the HLA region. The prevalence of type 1 diabetes may vary by age; we assumed a prevalence of 0.4% in all age-groups in the primary analysis but tested the stability of the estimates by performing sensitivity analyses where the assumed prevalence in the <7 group was higher at 0.5% and also, in separate analyses, calculated the heritability with an assumed prevalence of 0.2% and 0.3% in both the 7–13 and ≥13 groups.
Data and Resource Availability
The scripts used to perform these analyses are available at https://github.com/jinshaw16/AAD_t1d.
Results
Multinomial Logistic Regression: HLA
Six HLA variables were differentially associated between the <7 and ≥13 group (with FDR <0.1). The most strongly differentially associated locus between the age-at-diagnosis groups was the DR3-DQ2/DR4-DQ8 diplotype, where the diplotype was more prevalent in the <7 group compared with the ≥13 group, whereas the protective DRB1*15:01-DQB1*06:02 and DRB1*07:01-DQB1*03:03 haplotypes encoded greater protection from type 1 diabetes in the <7 group compared with the ≥13 group. Class I alleles A*24:02 and B*39:06 showed more susceptibility to type 1 diabetes in the <7 compared with the ≥13 group (Fig. 1). Comparison of imputed classical four-digit HLA alleles with directly genotyped four-digit HLA alleles showed concordance of >91% for each gene examined (Supplementary Fig. 2).

Classical HLA haplotype/alleles association with type 1 diabetes diagnosed at <7 years old (red circle; mean log-odds ratio age at diagnosis ± 95% CI), 7–13 years old (green circle; mean log-odds ratio age at diagnosis 7–13 ± 95% CI), and ≥13 years old (blue circle; mean log-odds ratio age at diagnosis ≥13 ± 95% CI), from a multinomial logistic regression. Left panel shows the log-odds ratios, with a dashed red line showing a log-odds ratio of 0. The right panel shows the association statistics from a likelihood ratio test comparing a multinomial logistic regression constraining the log-odds ratios from the <7 to ≥13 groups to be equal compared with an unconstrained model. The red dotted line shows nominal significance in heterogeneity (P < 0.05), and the red dashed line shows Bonferroni-corrected significance in heterogeneity. T1D, type 1 diabetes.
Classical HLA haplotype/alleles association with type 1 diabetes diagnosed at <7 years old (red circle; mean log-odds ratio age at diagnosis ± 95% CI), 7–13 years old (green circle; mean log-odds ratio age at diagnosis 7–13 ± 95% CI), and ≥13 years old (blue circle; mean log-odds ratio age at diagnosis ≥13 ± 95% CI), from a multinomial logistic regression. Left panel shows the log-odds ratios, with a dashed red line showing a log-odds ratio of 0. The right panel shows the association statistics from a likelihood ratio test comparing a multinomial logistic regression constraining the log-odds ratios from the <7 to ≥13 groups to be equal compared with an unconstrained model. The red dotted line shows nominal significance in heterogeneity (P < 0.05), and the red dashed line shows Bonferroni-corrected significance in heterogeneity. T1D, type 1 diabetes.
Multinomial Logistic Regression: Non-HLA Regions
Outside the HLA, seven regions were differentially associated between the <7 and ≥13 group (FDR < 0.1), near cathepsin H (CTSH), GLIS family zinc finger 3 (GLIS3), Ikaros family zinc finger 3 (IKZF3), chymotrypsinogen B1 (CTRB1), the third index variant at interleukin 2 receptor α (IL-2RA), THEMIS, and interleukin-10 (IL-10) (Fig. 2), with CTSH surviving Bonferroni correction (P < 0.05/55 = 0.00091). At each locus associated with FDR <0.1, the 7–13 group had a larger effect size than the ≥13 group and smaller than the <7 group. Given that the ≥13 group comprises just 1,708 individuals, it is probable that with increased sample size and hence statistical power, other type 1 diabetes risk loci might reach statistical significance with regards to heterogeneity (Supplementary Fig. 3). Of the 48 variants not satisfying an FDR <0.1, 21 had the strongest signal in <7, weakest in ≥13, and intermediate in 7–13, compared with eight occurrences in that order expected by chance (P = 9.74 × 10⁻⁶, binomial test), suggesting the presence of substantial additional signal overall despite not showing evidence individually.
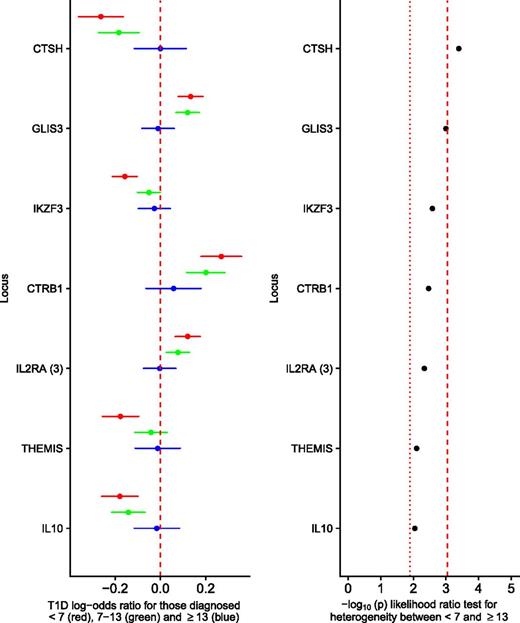
Non-HLA type 1 diabetes–associated loci showing on the left panel the log-odds ratios for the minor allele for those diagnosed at <7 years old (red circle; log-odds ratio age at diagnosis ± 95% CI), 7–13 years old (green circle; log-odds ratio age at diagnosis 7–13 ± 95% CI), and ≥13 years old (blue circle; log-odds ratio age at diagnosis ≥13 ± 95% CI), from a multinomial logistic regression; the dashed red line shows a log-odds ratio of 0. The right panel shows the association statistics from a likelihood ratio test comparing a multinomial logistic regression constraining the log-odds ratios from the <7 to ≥13 groups to be equal compared with an unconstrained model. The red dotted line shows the threshold for FDR of <0.1, and the red dashed line shows the threshold for Bonferroni-corrected heterogeneity (showing only loci with an FDR of <0.1). T1D, type 1 diabetes.
Non-HLA type 1 diabetes–associated loci showing on the left panel the log-odds ratios for the minor allele for those diagnosed at <7 years old (red circle; log-odds ratio age at diagnosis ± 95% CI), 7–13 years old (green circle; log-odds ratio age at diagnosis 7–13 ± 95% CI), and ≥13 years old (blue circle; log-odds ratio age at diagnosis ≥13 ± 95% CI), from a multinomial logistic regression; the dashed red line shows a log-odds ratio of 0. The right panel shows the association statistics from a likelihood ratio test comparing a multinomial logistic regression constraining the log-odds ratios from the <7 to ≥13 groups to be equal compared with an unconstrained model. The red dotted line shows the threshold for FDR of <0.1, and the red dashed line shows the threshold for Bonferroni-corrected heterogeneity (showing only loci with an FDR of <0.1). T1D, type 1 diabetes.
Stability of Non-HLA Results
In the U.K.-specific sensitivity analysis, performed to ensure no loci were declared differentially associated due only to differences in ancestry between groups, we found that five of the seven loci declared heterogeneous from the primary analysis were heterogeneous between the <7 and ≥13 group (FDR <0.1) (Supplementary Fig. 4). The locus near CTRB1 showed no differential association between age-at-diagnosis groups (P = 0.272) and was thus removed from the set of differentially associated loci, whereas the locus near IL10 had a P value of 0.07, which we considered differentially associated, given the decrease in statistical power in this sensitivity analysis.
In addition, when changing the threshold for the early-diagnosed group to <6 and <5 years to ensure that loci were not declared differentially associated due to only a chance association observed due to the choice of age-at-diagnosis group cutoff, all six associated loci from the primary analysis and U.K.-specific analysis were heterogeneous (FDR <0.1) (Supplementary Figs. 5 and 6).
Minor allele frequency plots by age at diagnosis for the six differentially associated loci are shown in Supplementary Figs. 7–12, and Supplementary Tables 3 and 4 summarize the most likely causal genes at these loci.
Fine Mapping
Fine-mapping analyses showed that five of the six differentially associated loci had high posterior probability of a single causal variant in the region (>0.8), whereas IL2RA had a higher posterior probability of having more than one causal variant in the region. Variants prioritized in the GUESSFM analysis for each region examined are listed in Supplementary Tables 5–10, although it is possible that variants excluded due to low imputation quality that are in LD with these variants could also be causal.
Three of the five regions fine mapped with high posterior probability of one causal variant in the region showed evidence of colocalization with whole-blood eQTLs. The CTSH locus showed evidence of colocalization with a CTSH eQTL (posterior probability of colocalization = 0.998); the minor protective allele for type 1 diabetes is associated with decreased expression of CTSH, or equivalently, the major allele is the type 1 diabetes risk allele and is associated with increased CTSH expression. The IKZF3 locus fine mapping results prioritized an LD block containing 103 variants, all of which could be causal. This same block of variants is also associated with altered expression of at least three genes (P < 5 × 10−150), with evidence of colocalization of disease signal and whole-blood eQTL for IKZF3, GSDMB, and ORMDL3 (posterior probability of colocalization for type 1 diabetes and eQTL with IKZF3 = 0.982, GSDMB = 0.981, and ORMDL3 = 0.981); the minor alleles at the block of variants associated with a decrease in type 1 diabetes risk are associated with decreased IKZF3 expression and, in contrast, with increased expression of GSDMB and ORMDL3. Finally, the most likely causal variants in the THEMIS region colocalize with a THEMIS whole-blood eQTL (posterior probability of colocalization = 0.953); the minor allele is protective for type 1 diabetes and is associated with decreased THEMIS expression (Fig. 3). There was minimal evidence of colocalization between the disease risk variants and PTPRK expression in whole blood (posterior probability of colocalization = 0.023).
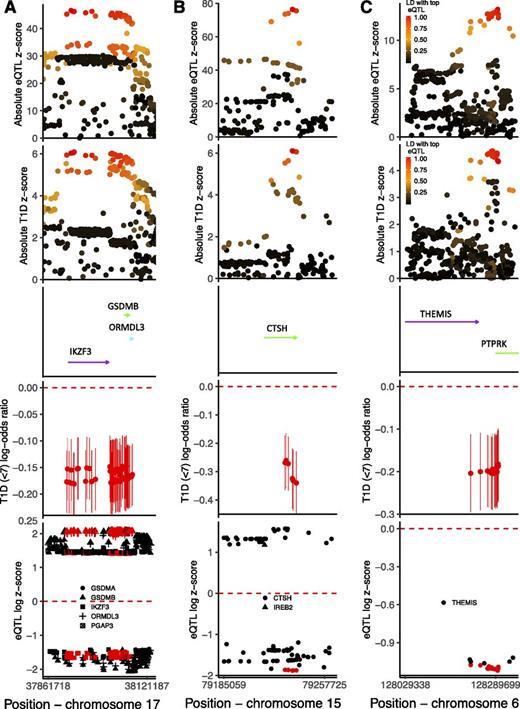
Results from colocalization and fine mapping in the IKZF3 region (A), CTSH region (B), and THEMIS region (C). Analyses include individuals from the U.K. and Northern Ireland and only control and case subjects diagnosed at <7 years. The first panel shows the association absolute z scores from a whole-blood eQTL study examining variant effects on IKZF3 (A), CTSH (B), and THEMIS (C) mRNA levels, colored by LD r2 to the most strongly associated variant with the respective mRNA expression. The second panel shows the association absolute z scores from logistic regression examining variant associations with type 1 diabetes risk at <7 years, colored by LD r2 to the most strongly associated variant with IKZF3 (A), CTSH (B), and THEMIS (C) mRNA. The third panel shows the gene positions (genome build 37), with arrows indicating direction of transcription. The fourth panel shows univariable early-diagnosed type 1 diabetes log-odds ratios and 95% CIs for the minor allele for each of the most likely causally associated variants as prioritized by GUESSFM. The fifth panel shows the loge(absolute eQTL z score) if z score >0 and −loge(absolute eQTL z score) if z score <0 for the effect of the minor allele, so direction of effect can be compared, including only eQTLs with a P value <5 × 10−150 (A), <5 × 10−50 (B), and <5 × 10⁻²⁵ (C). The symbols are colored red if contained in the set of most likely causal variants, as produced by GUESSFM, and the shape corresponds to the gene that the variant is affecting transcription of, with the genes shown in the center of the figure. T1D, type 1 diabetes.
Results from colocalization and fine mapping in the IKZF3 region (A), CTSH region (B), and THEMIS region (C). Analyses include individuals from the U.K. and Northern Ireland and only control and case subjects diagnosed at <7 years. The first panel shows the association absolute z scores from a whole-blood eQTL study examining variant effects on IKZF3 (A), CTSH (B), and THEMIS (C) mRNA levels, colored by LD r2 to the most strongly associated variant with the respective mRNA expression. The second panel shows the association absolute z scores from logistic regression examining variant associations with type 1 diabetes risk at <7 years, colored by LD r2 to the most strongly associated variant with IKZF3 (A), CTSH (B), and THEMIS (C) mRNA. The third panel shows the gene positions (genome build 37), with arrows indicating direction of transcription. The fourth panel shows univariable early-diagnosed type 1 diabetes log-odds ratios and 95% CIs for the minor allele for each of the most likely causally associated variants as prioritized by GUESSFM. The fifth panel shows the loge(absolute eQTL z score) if z score >0 and −loge(absolute eQTL z score) if z score <0 for the effect of the minor allele, so direction of effect can be compared, including only eQTLs with a P value <5 × 10−150 (A), <5 × 10−50 (B), and <5 × 10⁻²⁵ (C). The symbols are colored red if contained in the set of most likely causal variants, as produced by GUESSFM, and the shape corresponds to the gene that the variant is affecting transcription of, with the genes shown in the center of the figure. T1D, type 1 diabetes.
There was no evidence of colocalization between disease risk variants and whole-blood eQTL for any genes in the regions of GLIS3 or IL10 (posterior probability of colocalization <0.02) (Supplementary Figs. 13–16).
Heritability Estimates by Age-at-Diagnosis Group
We found the chip heritability estimate on the liability scale to be highest in the <7 group, intermediate in the 7–13 group, and lowest in the ≥13 group (<7 hg2 = 0.366, 7–13 hg2 = 0.301, and ≥13 hg2 = 0.233). This trend remained when altering the assumed disease prevalence by age-at-diagnosis group and when excluding the HLA region (Supplementary Table 11).
Conclusions
The stratification of patients by age at diagnosis according to islet phenotypes has provided a rich source of candidate genes and corresponding pathways, with greater effects in children diagnosed with type 1 diabetes under age 7 years. We expected to see differential associations with the HLA class II haplotypes, in particular the heterozygous diplotype DR3-DQ2/DR4-DQ8, as well as HLA class I alleles A*24:02 and B*39:06 (5–8). Here, we show for the first time that the protective HLA class II haplotypes DRB1*15:01-DQB1*06:02 and DRB1*07:01-DQB1*03:03 are less prevalent among individuals diagnosed at <7 years compared with those diagnosed at ≥13 years. Therefore, the earliest and most aggressive phenotypic subtype of type 1 diabetes results primarily from the carriage of high-risk alleles of the HLA class II and I genes. These likely act at one or more of four levels: 1) altering the T-cell receptor repertoire in favor of anti-islet antigen reactivity and/or reducing the protective repertoire of T-regulatory cells; 2) providing a strong autoantigen presentation environment in the islets, enabling the infiltration and cytolytic activity of CD8+ T cells but also by disrupting B-cell anergy (20), permitting binding and presentation of autoantigen to provide potent help to T cells; 3) affecting the immune response to the viral infections that are involved in the disease; and 4) affecting how the gut microbiome develops in early life, a system that is known to affect type 1 diabetes susceptibility (21).
In addition to the HLA heterogeneity, we obtained robust evidence of differences in effect size between the age-at-diagnosis groups at six non-HLA loci. Of these loci, one plausible candidate gene, GLIS3, most likely acts in the islet β-cells, given the expression levels in the pancreas, lack of expression in immune cells, colocalization with type 2 diabetes risk variants (22), and lack of association with other autoimmune diseases (https://genetics.opentargets.org). Genes in two of the loci, CTSH and IKZF3, could act in the islets or elsewhere, while all of the other candidate causal genes (IL2RA, IL10, THEMIS, IKZF3/ORMDL3/GSDMB, and CTSH) have known functions in T- and/or B-cell biology (Supplementary Table 4). This implies that in addition to HLA susceptibility, risk of type 1 diabetes in the very young is also impacted by particular malfunctions in the infiltrating T and B cells, resulting in a perfect storm of immune infiltration, antigen recognition, and a rapid destruction of β-cells.
Of the non-HLA risk regions with the strongest evidence of heterogeneity between age-at-diagnosis groups, we focus on CTSH, IKZF3, and THEMIS, which colocalize with whole-blood eQTLs. The minor T allele at one of the candidate causal variants at the CTSH locus, rs2289702 (C > T), is associated with protection from type 1 diabetes and decreased expression of CTSH mRNA in multiple cell types and tissues, or equivalently, the major C allele is the type 1 diabetes risk allele and is associated with increased expression of CTSH (Supplementary Table 4). The locus has previously been implicated in type 1 diabetes etiology by altering sensitivity of β-cells to apoptosis (23), where rs3825932 (C > T) was investigated, which is in low LD (r2 = 0.26) with the disease-associated variant reported here. However, the type 1 diabetes risk allele counter-intuitively resulted in protection from β-cell apoptosis, thus β-cell apoptosis may not be the primary mechanism underlying disease etiology in this region. CTSH functions as an endopeptidase and can cleave the N terminus of the Toll-like receptor 3 (TLR3) protein, increasing its functionality (24). Given that TLR3 is expressed in islets (25), it is possible that the increase in CTSH expression associated with the type 1 diabetes susceptibility allele results in increased TLR3 N terminus cleavage, heightened responses to viral infections, and increased release of type 1 interferon. This may increase the baseline risk of type 1 diabetes and specifically the risk of early-diagnosed type 1 diabetes in individuals carrying this allele, since viral infections are more frequent in childhood.
The large LD block in the IKZF3 region is associated with multiple diseases, including asthma and pediatric asthma (26,27). The direction of the effect of the risk variant is opposite in asthma to autoimmune diseases, where the C allele at a variant within the haplotype, rs921649 (C > T), increases susceptibility to autoimmunity but protects against asthma (26). The three genes most strongly associated with the haplotype are expressed in lymphocytes (https://dice-database.org/), with good biological candidacy for altering disease risk. IKZF3 is a transcriptional repressor with a key role in B-cell activation and differentiation (28) and T-cell differentiation (29). ORMDL3 is a central regulator of sphingolipid biosynthesis (30) and has also been proposed to negatively regulate store-operated calcium, lymphocyte activation, and cytokine production (26,31), while GSDMB can act as a pyroptotic protein (32). Therefore one or more of these genes may be causal for type 1 diabetes risk.
The colocalization between the type 1 diabetes disease association and a THEMIS whole-blood eQTL points toward THEMIS being the likely causal gene in this region. The minor T allele at one of the candidate causal variants, rs13204742 (G > T), is protective for early-diagnosed type 1 diabetes and celiac disease (33) but susceptible for irritable bowel disease (34). THEMIS, expressed in thymocytes and circulating T cells (Supplementary Table 4), is a key signaling molecule for T-cell development and survival (35). In the thymus, THEMIS sets signaling thresholds at the double-positive stage of thymocyte development and influences the selection of T cells. Deletion of THEMIS reduces the transition of double-positive to single-positive thymocytes (36,37). Our results suggest that an increase in THEMIS expression leads to increased risk of early-diagnosed type 1 diabetes. If we assume that the whole-blood eQTL with the disease risk variants is mirrored in the thymus, we hypothesize that the increased THEMIS expression would alter the threshold for positive selection and increase the probability of autoreactive T cells entering circulation.
The increased heritability of early-diagnosed compared with later-diagnosed type 1 diabetes should be interpreted with caution given that the ImmunoChip design is primarily focused on immune regions and designed to capture regions of interest in autoimmune diseases. It is possible that those individuals diagnosed with type 1 diabetes later in life have a different profile of susceptibility regions that are not captured on the ImmunoChip due to insufficient statistical power to detect such loci in previous genome-wide association studies. Nevertheless, it is interesting to note that among the susceptibility regions for type 1 diabetes discovered to date, there appears to be a higher heritability in those diagnosed at a young age compared with at ≥13 years, consistent with increasing age accompanying greater risk and length of exposure to environmental type 1 diabetes causal factors.
One weakness of our analysis is the relatively small sample size in the ≥13 group compared with the <7 and 7–13 groups. Increasing the sample size of this group would lead to more accurate estimates of effect sizes of the variants on type 1 diabetes risk at ≥13 years and thus more robust heterogeneity test results. However, the observed trend, whereby the largest effect tends to be in the <7 group, the intermediate effect in the 7–13 group, and the smallest effect in the ≥13 group, increases confidence in the results, as the 7–13 group is well powered and alone shows several differences in effect sizes with the youngest group.
We have highlighted a number of chromosome regions most strongly associated with early-diagnosed type 1 diabetes. The candidate causal genes within these regions suggest that early diagnosis could be driven by a fully integrated pathogenic collaboration between the immune system, the β-cells, and viral infection in the initiation and rapid development of extreme insulin deficiency.
Article Information
Acknowledgments. The authors thank all participants for allowing the analysis of their genotypic and phenotypic data.
Funding. This work was funded by JDRF (9-2011-253 and 5-SRA-2015-130-A-N) and Wellcome (091157 and 107212) to the Diabetes and Inflammation Laboratory, University of Oxford. We used data generated by the Wellcome Trust Case Control Consortium (076113). The Northern Irish Genetic Resource Investigating Diabetes, Tyypin 1 Diabetekseen Sairastuneita Perheenjäsenineen, Tyypin 1 Diabetekseen Genetiikka, and Warren cohorts were genotyped using the Type 1 Diabetes Genetics Consortium grants from the National Institute of Diabetes and Digestive and Kidney Diseases, the National Institute of Allergy and Infectious Diseases, the National Human Genome Research Institute, and the National Institute of Child Health and Human Development (U01-DK-062418) and JDRF (9-2011-530). This research was supported by the Wellcome Trust Core Award (grant 203141/Z/16/Z), with additional support from the National Institute for Health Research Oxford Biomedical Research Centre.
Duality of Interest. No potential conflicts of interest relevant to this article were reported.
Author Contributions. J.R.J.I. performed the analyses and drafted the main body of the manuscript. A.J.C. provided assistance with the manuscript writing and performed a thorough literature search for age at diagnosis–associated regions. D.J.M.C. provided statistical support and guidance for J.R.J.I. as well as critically reviewed the manuscript. L.S.W. provided critical feedback for the manuscript and immunological support and context. J.A.T. supervised the work, proposed the research hypothesis, and critically evaluated the manuscript. J.A.T. is the guarantor of this work and, as such, had full access to all the data in the study and takes responsibility for the integrity of the data and the accuracy of the data analysis.
See accompanying article, p. .