


We aimed to investigate the rate of progression of nonalbuminuric chronic kidney disease (CKD) to end-stage kidney disease (ESKD) or death or major cardiovascular events (MACE) compared with albuminuric and nonalbuminuric phenotypes.
We included 10,185 participants with type 2 diabetes enrolled in the Action to Control Cardiovascular Risk in Diabetes (ACCORD) study. Based on baseline albuminuria and estimated glomerular filtration rate (eGFR), participants were classified as having no kidney disease (no CKD), albuminuria only (albuminuric non-CKD), reduced eGFR only (nonalbuminuric CKD), or both albuminuria and reduced eGFR (albuminuric CKD). The rate of eGFR decline and hazard ratios (HRs) for ESKD or death or MACE were calculated.
For individuals with no CKD and those with nonalbuminuric CKD, the rates of eGFR decline were −1.31 and −0.60 mL/min/year, respectively (P < 0.001). In competing-risks analysis (no CKD as the reference), HRs for ESKD indicated no increased risk for nonalbuminuric CKD (0.76 [95% CI 0.34, 1.70]) and greatest risk for albuminuric CKD (4.52 [2.91, 7.01]). In adjusted Cox models, HRs for death and MACE were highest for albumuniuric CKD (2.38 [1.92, 2.90] and 2.37 [1.89, 2.97], respectively) and were higher for albuminuric non-CKD (1.82 [1.59, 2.08] and 1.88 [1.63, 2.16], respectively) than for those with nonalbuminuric CKD (1.42 [1.14, 1.78] and 1.44 [1.13, 1.84], respectively).
Those with nonalbuminuric CKD showed a slower rate of decline in eGFR than did any other group; however, these individuals still carry a greater risk for death and MACE than do those with no CKD.
Introduction
Diabetic kidney disease is one of the most frequent complications of both types of diabetes and is the leading cause of end-stage kidney disease (ESKD) in the general population (1,2).
Traditionally, most people with diabetic kidney disease are believed to develop albuminuria prior to a fall in glomerular filtration rate (GFR) (3). However, the literature suggests that a significant proportion of people with diabetes have kidney disease as defined by abnormal estimated GFR (eGFR) even without albuminuria, and more recent studies suggest that this has become more prevalent in type 2 diabetes (4–8).
People with albuminuric chronic kidney disease (CKD) have significant risk of progression to ESKD and have increased all-cause and cardiovascular mortality (9,10). However, the risk of progression of nonalbuminuric renal impairment in diabetes has not been investigated thoroughly. Thus, the clinical and prognostic implications of this phenotype remain unclear. Our group recently presented an analysis of the Chronic Renal Insufficiency Cohort (CRIC) Study (11), exploring this issue among people with diabetes, and showed that progression to ESKD is very low among people with nonalbuminuric renal impairment.
In the CRIC, however, all study participants had renal impairment at baseline. Thus, we were unable to compare the nonalbuminuric renal impairment group with a nonalbuminuric group with normal eGFR. Furthermore, we did not report on mortality and cardiovascular events in the CRIC, although CKD is strongly associated with these outcomes. To address these limitations, we have now explored this issue in a population with diabetes that includes those with normal renal function. The aim of this study was to determine the rate of progression of nonalbuminuric CKD to ESKD or death or major cardiovascular events (MACE) compared with albuminuric CKD and to albuminuric and nonalbuminuric groups with normal eGFR using the Action to Control Cardiovascular Risk in Diabetes (ACCORD) clinical trial and posttrial data set.
Research Design and Methods
Study Design and Participants
ACCORD was a multicenter randomized controlled trial in the U.S. and Canada that examined whether intensive glycemic control, lipid management, and intensive blood pressure control could prevent MACE (myocardial infarction, stroke, or cardiovascular death) among people with type 2 diabetes. A detailed description of the study design has been published (12,13). Briefly, between 2003 and 2005, a total of 10,251 participants with type 2 diabetes were enrolled based on age (40–79 years), the presence of high risk of having a cardiovascular event, and HbA1c ≥7.5%, from 77 centers across the U.S. and Canada. The ACCORDION study continued observation of willing participants (n = 8,601) representing 98% of 8,777 people without a primary outcome event for long-term follow-up after they completed the trial (14). The average duration of the ACCORD trial was 5 years, and the average combined duration of the ACCORD and ACCORDION trials was 9 years. In the current analysis, a total of 10,185 people were included for whom complete information on albuminuria status and eGFR at baseline was available (Supplementary Fig. 1).
Measurements
Sociodemographics, medical history, concomitant medications use, lifestyle behaviors, health-related quality of life, physical examination, and laboratory data were collected with frequency of measurement varying by treatment assignment, but at least at baseline, every 2 years, and at the end of the trial or posttrial visits (14).
Measurement of urine albumin-to-creatinine ratio (UACR) was performed on spot urine samples at baseline, 24 months, and 48 months after randomization and at the end of follow-up. Serum creatinine was measured at baseline, at every 4 months throughout the trial, and at the end of the trial or posttrial visits. To confirm the serum creatinine value, participants were asked to attend a repeat serum creatinine measurement if an eGFR fell to <30 mL/min/1.73 m2. eGFR was calculated by the four-variable MDRD equation (15). Both UACR and serum creatinine were measured at the ACCORD central laboratories. Detailed information about measurement methods for laboratory parameters is described in previous reports (12,16).
Albuminuria was defined as a UACR of ≥3.4 mg/mmol (≥30 mg/g). CKD was defined as eGFR <60 mL/min/1.73 m2. Based on baseline UACR and eGFR, study participants were divided into four groups: no CKD (UACR <3.4 mg/mmol [<30 mg/g] and eGFR ≥60 mL/min/1.73 m2), albuminuric non-CKD (UACR ≥3.4 mg/mmol [≥30 mg/g] and eGFR ≥60 mL/min/1.73 m2), albuminuric CKD (UACR ≥3.4 mg/mmol [≥30 mg/g] and eGFR <60 mL/min/1.73 m2), and nonalbuminuric CKD (UACR <3.4 mg/mmol [<30 mg/g] and eGFR <60 mL/min/1.73 m2). The no CKD group was further subclassified into the following categories: hyperfiltration (≥120 mL/min/1.73 m2), normal eGFR or normal kidney function (90–120 mL/min/1.73 m2), and mildly decreased eGFR (60–90 mL/min/1.73 m2).
Study Outcomes
The prespecified renal outcomes in the ACCORD trial were: new or worsening nephropathy; doubling of serum creatinine or reduction in eGFR at least 20 mL/min per 1.73 m2; and ESKD (defined as a need for dialysis or renal transplantation or rise of serum creatinine >291.72 μmol/L in the absence of an acute reversible cause). Other outcomes included all-cause mortality, cardiovascular mortality, MACE, major hypoglycemia, retinopathy, and neuropathy. In this analysis, we specifically focused on the rate of kidney function decline or ESKD, all-cause mortality, and MACE (13). ESKD events occurring during the posttrial period were not reported in the data set. Thus, for the posttrial period, we defined ESKD as progression to sustained eGFR ≤15 mL/min/1.73 m2.
Statistical Analysis
Differences in means or proportions of risk factors across groups were compared using ANOVA or χ2 tests as appropriate. Cox proportional hazards models were used to model association of baseline albuminuria and eGFR with time to all-cause mortality and MACE. The competing risks method (with death as a competing risk) was used for the analysis of the risk of ESKD (17).
To estimate the rate of eGFR decline and to compare the rates among groups, we used joint longitudinal-survival modeling, an advanced statistical approach, to take into account the possibility of informative censoring due to the shorter follow-up duration of subjects with more rapid decline (18–20). For the longitudinal part of the joint model, the linear mixed model with random intercept and slope was used to model changes in eGFR for each group, while for the survival model, a proportional hazard model with Weibull baseline hazard was used with rate of eGFR declines as covariate. These models were adjusted for covariates including age, sex, race/ethnicity, duration of diabetes, smoking, history of cardiovascular disease (CVD), baseline serum lipid levels, baseline BMI, systolic blood pressure, glycated hemoglobin, and use of renin-angiotensin-aldosterone system (RAAS) blockade. The percentage of observations with missing data was only 2.1%. Given this small percentage of incomplete observations and the fact that a joint model, when restricted to participants with complete observations, is robust when the missing data were missing-at-random (21), multiple imputation was not performed, and only participants with complete observations were analyzed.
Using output of the joint model, we then performed additional analyses to determine the threshold of baseline UACR at which the magnitude of eGFR slope began to decrease sharply. The individual slopes of eGFR from the joint model were plotted against baseline UACR using median regression with restricted cubic splines (22).
A horizontal line was drawn through the point at which the estimated median slope crossed the traditional UACR cut point for microalbuminuria, and this line represents “slow rate of progression.” The threshold for faster decline is then chosen as the baseline UACR at which the 95% CI for eGFR slopes fall below this line. All statistical analyses were performed using Stata, version 14.1 (Stata Corporation).
We received a de-identified data set from the National Heart, Lung, and Blood Institute (NHLBI) Biologic Specimen and Data Repository Information Coordinating Center (BioLINCC) after institutional review board approval from the human research ethics committees of the Alfred Hospital (project number 214/18) and Monash University (project number 13458; Melbourne, Australia).
Results
This study includes 10,185 people with type 2 diabetes who were enrolled into the ACCORD clinical trial. The median in-trial and total follow-up periods were 5.0 and 8.8 years, respectively. Characteristics of the study participants at baseline are summarized in Table 1. The prevalence of diabetic kidney disease phenotypes was 28.1% for albuminuric non-CKD, 4.3% for nonalbuminuric CKD, and 3.4% for albuminuric CKD. People with nonalbuminuric CKD were older, more frequently women, and nonsmokers and had lower systolic and diastolic blood pressure compared with those with no CKD and to those with albuminuria. In addition, RAAS blockade prescription was higher in the nonalbuminuric CKD group compared with no CKD or albuminuric non-CKD groups but not to those with albuminuric CKD. Similar differences in smoking status, systolic and diastolic blood pressure, and RAAS blockade usage among groups were seen at the end of the trial (ACCORD) and at the end of the entire study (ACCORDION) (Supplementary Table 1).
Baseline characteristics of study participants by baseline CKD status
| Variables | Overall | No CKD* | Albuminuric non-CKD | Albuminuric CKD | Nonalbuminuric CKD | P | ||
|---|---|---|---|---|---|---|---|---|
| eGFR (≥120) | eGFR (90–120) | eGFR (60–90) | ||||||
| n (%) | 10,185 | 791 (7.8) | 2,724 (26.7) | 3,026 (29.7) | 2,867 (28.1) | 345 (3.4) | 432 (4.3) | |
| Age (years), median (IQR) | 62.0 (57.7, 67.1) | 59.3 (56.5, 63.2) | 59.7 (56.7, 63.5) | 63.9 (59.1, 68.8) | 62.2 (57.8, 67.3) | 66.0 (62.1, 71.2) | 66.7 (62.4, 72) | 0.0001 |
| Male, n (%) | 6,260 (61.5) | 461 (58.4) | 1,662 (61) | 1,818 (60.1) | 1,967 (68.5) | 172 (49.8) | 180 (41.6) | <0.0001 |
| Race, n (%) | <0.0001 | |||||||
| White | 6,352 (62.4) | 423 (53.5) | 1,669 (61.3) | 2,022 (66.8) | 1,689 (58.9) | 232 (67.3) | 317 (73.3) | |
| Black | 1,943 (19.1) | 169 (21.3) | 573 (21) | 473 (15.6) | 637 (22.2) | 50 (14.5) | 41 (9.5) | |
| Hispanic | 730 (7.1) | 83 (10.5) | 176 (6.5) | 200 (6.6) | 222 (7.8) | 22 (6.4) | 27 (6.3) | |
| Other | 1,160 (11.4) | 116 (14.7) | 306 (11.2) | 331 (11) | 319 (11.1) | 41 (11.8) | 47 (10.9) | |
| Education, n (%) | <0.0001 | |||||||
| Less than high school | 1,509 (14.8) | 134 (17) | 339 (12.4) | 406 (13.4) | 504 (17.6) | 56 (16) | 69 (15.8) | |
| High school graduate | 2,684 (26.4) | 219 (27.7) | 699 (25.6) | 782 (25.9) | 748 (26.1) | 96 (27.8) | 141 (32.8) | |
| Some college | 3,344 (32.8) | 226 (28.5) | 941 (34.6) | 999 (33) | 949 (33.1) | 103 (29.8) | 126 (29.2) | |
| College graduate or higher | 2,648 (26) | 212 (26.8) | 745 (27.4) | 839 (27.7) | 666 (23.2) | 90 (26.4) | 96 (22.2) | |
| Current smoker, n (%) | 1,421 (13.9) | 141 (17.8) | 394 (14.5) | 319 (10.5) | 497 (17.3) | 44 (12.7) | 26 (6) | <0.0001 |
| HbA1c (%), mean (SD) | 8.3 (1.0) | 8.3 (1.1) | 8.2 (1.0) | 8.1 (0.9) | 8.4 (1.1) | 8.3 (1.0) | 8.1 (1.0) | <0.0001 |
| HbA1c (mmol/mol), mean (SD) | 67.2 (11.5) | 67.9 (11.7) | 66.9 (11.3) | 65.4 (10.6) | 69.3 (12.2) | 67.9 (11.3) | 65.3 (11.2) | <0.0001 |
| BMI (kg/m2), mean (SD) | 32.2 (5.4) | 32 (5.6) | 32.2 (5.3) | 31.9 (5.2) | 32.4 (5.5) | 32.7 (5.7) | 32.4 (5.4) | <0.05 |
| Triglycerides (mg/dL), median (IQR) | 155 (106, 229) | 152 (100, 235) | 147 (100, 214) | 152 (106, 220) | 160 (110, 242) | 188 (125, 261) | 171 (119, 242) | <0.0001 |
| Total cholesterol (mg/dL), mean (SD) | 183.2 (41.7) | 185.7 (40.5) | 183.3 (40.3) | 180.4 (39.7) | 184.6 (44.8) | 186.1 (45.4) | 186.9 (41.5) | <0.0001 |
| HDL cholesterol (mg/dL), mean (SD) | 41.8 (11.6) | 42.2 (10.8) | 42.5 (11.4) | 42.1 (11.7) | 41 (11.8) | 39.9 (11.4) | 42.2 (11.2) | <0.0001 |
| Systolic BP (mmHg), mean (SD) | 136.3 (17.1) | 133.8 (15.0) | 133.8 (15.8) | 133.7 (16.4) | 141.6 (17.8) | 144.8 (18.8) | 133.0 (17.0) | <0.0001 |
| Diastolic BP (mmHg), mean (SD) | 74.9 (10.6) | 75.4 (9.8) | 75.8 (10.2) | 73.7 (10.4) | 75.9 (10.9) | 72.6 (12.0) | 70.8 (10.6) | <0.0001 |
| RAAS blockade, n (%) | 7,047 (69.2) | 503 (63.6) | 1,754 (64.4) | 2,074 (68.5) | 2,111 (73.5) | 270 (78.3) | 335 (77.5) | <0.0001 |
| Hypertension duration (years), median (IQR) | 7 (3, 15) | 6 (3, 13) | 5 (2, 13) | 7 (3, 15) | 8 (4, 16) | 10 (5, 18) | 8 (3, 16) | 0.0001 |
| CVD history, n (%) | 3,585 (35.2) | 236 (29.9) | 834 (30.6) | 1,004 (33.2) | 1,173 (40.8) | 166 (48.1) | 172 (39.8) | <0.0001 |
| Diabetes duration (years), median (IQR) | 9 (5, 15) | 8 (5, 13) | 8 (4, 13) | 9 (5, 15) | 10 (6, 17) | 15 (8, 21) | 10 (6, 16) | 0.0001 |
| Diabetic retinopathy, n (%) | 1,047 (11.7) | 36 (5.6) | 185 (7.5) | 271 (10.2) | 402 (16.2) | 89 (29.9) | 64 (17.4) | 0.0001 |
| UACR (mg/mmol), median (IQR) | 1.6 (0.8, 5.0) | 1.1 (0.6, 1.6) | 1.0 (0.6, 1.6) | 0.9 (0.6, 1.6) | 10.2 (5.4, 26.0) | 14.5 (6.2, 49.0) | 1.1 (0.7, 2.0) | 0.0001 |
| UACR (mg/g), median (IQR) | 14 (7.1, 44) | 10 (7, 16) | 8 (5, 14) | 8 (5, 14) | 90 (48, 232) | 128 (55, 436) | 10 (6, 18) | 0.0001 |
| eGFR (mL/min/1.73 m2), median (IQR) | 89.6 (75.3, 105.0) | 130.9 (123.0, 141.0) | 102.0 (92.2, 107.1) | 78.2 (71.4, 82.1) | 90.3 (77.0, 105.7) | 53.1 (47.7, 57.3) | 53.7 (48.2, 57.9) | 0.0001 |
BP, blood pressure; IQR, interquartile range.
*eGFR in mL/min/1.73 m2.
Renal function changes during the total study period were evaluated with 109,783 (mean [SD] 12 [4] per person) eGFR values (Supplementary Fig. 1). Using joint longitudinal-survival modeling, the adjusted mean (SD) eGFR change for the overall study period was −1.31 (2.23) mL/min/1.73 m2 for people with normoalbuminuria and normal eGFR and −0.60 (1.28) mL/min/1.73 m2 for nonalbuminuric CKD (95% CI 0.51, 0.90; P < 0.001). In the no CKD subgroups with hyperfiltration and mildly decreased eGFR, the adjusted mean (SD) change in eGFR was −2.53 (2.78) and −0.91 (1.91), respectively (Table 2).
Annual change in eGFR by baseline CKD status
| CKD status | N§ | Absolute eGFR change (mL/min/1.73 m2/year) | Percentage eGFR change (% per year) | ||
|---|---|---|---|---|---|
| Unadjusted eGFR change | Adjusted eGFR change | Difference in eGFR change (95% CI) | |||
| No CKD* | |||||
| eGFR (≥120) | 775 | −2.53 (2.93) | −2.53 (2.78) | −1.22 (−1.50, −0.93) | −1.76 (1.57) |
| eGFR (90–120) | 2,684 | −1.28 (2.27) | −1.31 (2.23) | Reference | −1.24 (1.82) |
| eGFR (60–90) | 2,975 | −0.92 (1.95) | −0.91 (1.91) | 0.40 (0.26, 0.53) | −1.15 (2.06) |
| Albuminuric non-CKD | 2,814 | −2.65 (2.84) | −2.51 (2.82) | −1.20 (−1.37, −1.02) | −2.60 (2.54) |
| Albuminuric CKD | 330 | −1.81 (2.13) | −1.75 (2.17) | −0.44 (−0.74, −0.13) | −3.20 (3.57) |
| Nonalbuminuric CKD | 424 | −0.61 (1.33) | −0.60 (1.28) | 0.60 (0.51, 0.90) | −1.10 (1.88) |
Data are mean (SD) unless otherwise indicated. Adjusted for age, sex, race/ethnicity, duration of diabetes, smoking, history of CVD, baseline serum lipid levels, baseline BMI, systolic blood pressure, glycated hemoglobin, and use of RAAS blockade. Baseline eGFR is not included in the covariate set, as it is already present in joint longitudinal-survival model specification.
Number of people with more than two eGFR measurements including baseline measurement.
*eGFR in mL/min/1.73 m2.
We also calculated the annual percentage change in eGFR for each group. The average annual percentage declines (SD) in eGFR were −1.10% (1.88%) in nonalbuminuric CKD, −1.24% (1.82%) in people with normoalbuminuria and normal eGFR, −2.60% (2.54%) in people with albuminuric non-CKD, and −3.20% (3.57%) in those with albuminuric CKD (Table 2).
As shown in Fig. 1, the trend line and 95% CIs for the mean slope of eGFR began to fall when baseline UACR exceeded ∼5.6 mg/mmol (50 mg/g) in those with baseline eGFR <60 mL/min/1.73 m2. Those with a baseline UACR >5.6 mg/mmol (50 mg/g) had a faster rate of eGFR decline (more negative slope) than those with baseline UACR <5.6 mg/mmol (50 mg/g).
![Figure 1. Annual rate of change of eGFR according to baseline UACR, stratified by baseline eGFR. People with baseline eGFR ≥60 mL/min/1.73 m2 (top) and <60 mL/min/1.73 m2 (bottom). The trend line for the relationship is shown by the median regression with restricted cubic splines. The blue horizontal solid line indicates slow rate of progression. The red vertical dashed line is the traditional UACR cut point for microalbuminuria (UACR = 3.4 mg/mmol [30 mg/g]); the black vertical dashed line is the threshold for baseline UACR (UACR = 5.6 mg/mmol [50 mg/g]), at which decline in eGFR began to speed up.](https://ada.silverchair-cdn.com/ada/content_public/journal/care/43/1/10.2337_dc19-1438/2/m_dc191438f1.jpeg?Expires=1716287752&Signature=QJO46egeqR6b7Z7ey~1kX2moUKVu39HYjaJI2p06a1aXhnhZXU1e~ZYMlVsqjLMYaa39Nx5gjHczxnVYXJI0tU62duicGSDbx7YoYWjCozFWoeOvgEGjBttzXpjudyBwzJbsyiTpYBWActcZ7jAm--EsdQJvT~CzJEy2vjlARKRen7Hvxkr8ywzOhzYlPhPkRaPs7CcFGhSbQvEbLH6hN3Sn1AD7EsxkkiaxNI7D7MMkiRXCf6QwbiS5Gwxt7sd0HiPyy6BiDiqILww3rico922hON5QlGExp6A7Wcc2-Vq4kBeQHicaVkDn4r08HmcGkgy5Fo-rnhoA0oJIA0JkVw__&Key-Pair-Id=APKAIE5G5CRDK6RD3PGA)
Annual rate of change of eGFR according to baseline UACR, stratified by baseline eGFR. People with baseline eGFR ≥60 mL/min/1.73 m2 (top) and <60 mL/min/1.73 m2 (bottom). The trend line for the relationship is shown by the median regression with restricted cubic splines. The blue horizontal solid line indicates slow rate of progression. The red vertical dashed line is the traditional UACR cut point for microalbuminuria (UACR = 3.4 mg/mmol [30 mg/g]); the black vertical dashed line is the threshold for baseline UACR (UACR = 5.6 mg/mmol [50 mg/g]), at which decline in eGFR began to speed up.
Annual rate of change of eGFR according to baseline UACR, stratified by baseline eGFR. People with baseline eGFR ≥60 mL/min/1.73 m2 (top) and <60 mL/min/1.73 m2 (bottom). The trend line for the relationship is shown by the median regression with restricted cubic splines. The blue horizontal solid line indicates slow rate of progression. The red vertical dashed line is the traditional UACR cut point for microalbuminuria (UACR = 3.4 mg/mmol [30 mg/g]); the black vertical dashed line is the threshold for baseline UACR (UACR = 5.6 mg/mmol [50 mg/g]), at which decline in eGFR began to speed up.
During a median follow-up of 8.8 years, 324 (3.2%) people developed ESKD, 1,812 (17.8%) people had a MACE, and 1,940 (19%) died. Of the 1,940 deaths, 663 (34.2%) were attributed to cardiovascular causes. Crude ESKD rates were lowest for nonalbuminuric CKD and highest for albuminuric CKD with a higher ESKD rate for albuminuric non-CKD than for no CKD, irrespective of eGFR subgroup. The results were identical in the analysis using a competing-risks model. In the adjusted competing-risks model, compared with the nonalbuminuric group with normal eGFR (reference group), people with nonalbuminuric CKD had similar risks for developing ESKD (hazard ratio [HR] 0.76 [95% CI 0.34, 1.70]). In contrast, the risk of ESKD was significantly increased for the groups with albuminuria (albuminuric non-CKD and CKD; HR 1.72 [95% CI 1.27, 2.34] and 4.52 [2.91, 7.01], respectively) (Fig. 2).
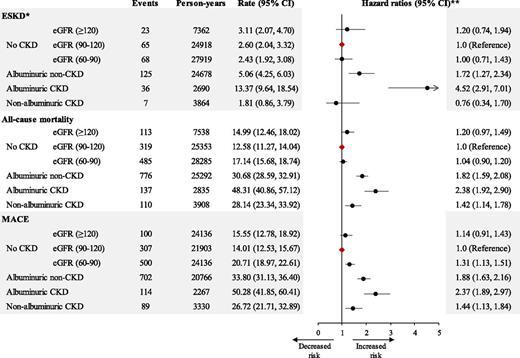
Risk of ESKD, all-cause mortality, or MACE by baseline CKD status. Crude rate and adjusted HRs (·) with 95% CIs (horizontal line) are shown for ESKD, all-cause mortality, and MACE that occurred from the baseline until the end of the entire study. The diamonds represent the reference group. *Death as competing risk. **Adjusted for age, sex, race/ethnicity, duration of diabetes, smoking, history of CVD, serum lipid levels, systolic blood pressure, BMI, glycated hemoglobin, and use of RAAS blockade. eGFR in mL/min/1.73 m2.
Risk of ESKD, all-cause mortality, or MACE by baseline CKD status. Crude rate and adjusted HRs (·) with 95% CIs (horizontal line) are shown for ESKD, all-cause mortality, and MACE that occurred from the baseline until the end of the entire study. The diamonds represent the reference group. *Death as competing risk. **Adjusted for age, sex, race/ethnicity, duration of diabetes, smoking, history of CVD, serum lipid levels, systolic blood pressure, BMI, glycated hemoglobin, and use of RAAS blockade. eGFR in mL/min/1.73 m2.
Crude all-cause mortality and MACE rates were lowest for people with normoalbuminuria and normal eGFR, highest for albuminuric CKD, and intermediate for people with no CKD with hyperfiltration and mildly decreased eGFR, albuminuric non-CKD, and nonalbuminuric CKD. These patterns were virtually identical in the Cox model adjusted for multiple confounders (Fig. 2).
Conclusions
The current study showed that people with nonalbuminuric CKD have a slow rate of eGFR decline, which is even slower than in those with normal kidney function. This low rate of eGFR decline in nonalbuminuric CKD is consistent with our previous analysis of the CRIC (23) and with a recent analysis of biopsy-proven diabetic kidney disease in Japan (24). However, neither of these other studies included participants without any evidence of kidney disease and were, therefore, not able to make direct comparisons with our group of interest.
Our findings were consistent across different analyses, taking into consideration both eGFR time-series data and times to ESKD or censoring. Furthermore, both the absolute rate of eGFR decline and the annual percentage change in eGFR demonstrated that kidney disease in people with nonalbuminuric CKD progressed more slowly than in any other group, including people with normal kidney function. Similarly, Hoefield et al. (25) showed that those with normal albuminuria have a slow rate of eGFR decline with 0.3% per year compared with 5.7% in those with increased albuminuria. In contrast to our findings, MacIsaac et al. (26) reported that both nonalbuminuric and albuminuric groups have high rates of kidney disease progression with mean declines of eGFR at −4.6 mL/min/year and −3.0 mL/min/year, respectively. However, it should be noted that this study was clinic-based and had a small sample size (n = 34), and the precise pattern of eGFR trajectories could not be ascertained.
Of note, we observed that the no CKD with mildly decreased eGFR subgroup had a slower rate of eGFR decline than did people with normal kidney function (no CKD with normal eGFR), but not compared with those with nonalbuminuric CKD. In contrast, those with no CKD with hyperfiltration showed a faster decline in eGFR. This possibly represents the resolution of hyperfiltration, because, as shown in the Supplementary Data, the median eGFR remained within the normal range at the end of the trial or entire study in this subgroup.
Although the risk for rapid decline of eGFR increased with worsening albuminuria, we observed that the relationship was relatively flat up to baseline UACR of 5.6 mg/mmol (50 mg/g) and increased progressively thereafter in the CKD group (eGFR <60 mL/min/1.73 m2). The baseline UACR of 5.6 mg/mmol (50 mg/g) in the current study is within the microalbuminuria range, and our data suggest that individuals with a UACR <5.6 mg/mmol (50 mg/g) have a comparatively low risk for subsequent eGFR decline, even if they have an eGFR <60 mL/min/1.73 m2. There is no easy explanation for this observation other than the relatively higher proportion of RAAS blockade usage, lower prevalence of smoking, and CVD history in nonalbuminuric CKD compared with the albuminuric CKD. In contrast to our findings, there are studies that showed that very low levels of albuminuria (<30 mg/24 h) are associated with increased risk of renal events (5). As further evidence of the benign renal course for people with nonalbuminuric CKD, we also found their risk of ESKD to be no greater than in those with normal kidney function. In keeping with the lower rate of decline of eGFR, the point estimate of the HR suggested a lower risk of ESKD than among those with normal kidney function, although this was not significant.
There are several possible explanations for our findings. It is possible that nonalbuminuric CKD mainly reflects an age-related decline in renal function, rather than a primary renal disease. However, nonalbuminuric CKD has been reported in both younger and older individuals with diabetes (27,28). Another possibility is that the nonalbuminuric CKD group is enriched with people with who are super responders to RAAS blockade, leading to normalization of UACR and to low risk of kidney disease progression. However, this is unlikely, because within the nonalbuminuric CKD group, eGFR decline was unrelated to baseline use of RAAS blockade. This is in keeping with our analysis of the CRIC (11). Finally, it is possible that nonalbuminuric CKD identifies individuals with as-yet-unidentified renoprotective features, the elucidation of which might further our understanding of the progression of kidney disease in diabetes.
Although risk for ESKD was very low in people with nonalbuminuric CKD, reduced eGFR was still an important marker for all-cause mortality and MACE. This is consistent with a recent European study that showed that reduced eGFR is a major prognostic factor in all-cause mortality and MACE, irrespective of albuminuria in people with type 2 diabetes (29,30).
The strengths of the current study are the large sample size, long follow-up, frequent serum creatinine sampling, and advanced statistical methods. We also have to acknowledge our limitations. Our study lacked complete follow-up data on UACR. Thus, we were unable to account for changing UACR during the follow-up period. Also, the generalizability of our findings may be limited to some extent, because the population was drawn from a clinical trial. Nevertheless, ACCORD included a diverse group of people with type 2 diabetes, and we believe that our findings add significantly to the understanding and phenotyping of people with nonalbuminuric CKD in type 2 diabetes, confirming and extending our previous findings.
Our study demonstrated that those with nonalbuminuric CKD have a slower rate of decline in eGFR than did any other group, including those with normal renal function, suggesting the presence of renoprotective factors. However, these individuals still carry a greater risk for all-cause mortality and MACE than do those with normal renal function. With increasingly prevalent nonalbuminuric CKD in diabetes, more studies are warranted to clarify its underlying mechanisms or pathogenesis.
Article Information
Acknowledgments. The authors thank the participants and investigators of the ACCORD study and NHLBI BioLINCC for the contributions and for providing access to this valuable data set.
Funding. The ACCORD study was conducted by the ACCORD study investigators and supported by the NHLBI, by other components of the National Institutes of Health, including the National Institute of Diabetes and Digestive and Kidney Diseases, the National Institute on Aging, and the National Eye Institute, by the Centers for Disease Control and Prevention, and by General Clinical Research Centers. Data from ACCORD and ACCORDION studies reported in this article were obtained from the NHLBI BioLINCC. O.B. is supported by a Monash University Postgraduate Research Scholarship and a Baker Bright Sparks Scholarship. D.J.M. and J.E.S. are supported by National Health and Medical Research Council Senior Research Fellowships. This work is partially supported by the Victorian Government’s Operational Infrastructure Support Program.
This study does not necessarily reflect the opinions or reviews of the ACCORD study investigators or the National Heart, Lung, and Blood Institute.
Duality of Interest. No potential conflicts of interest relevant to this article were reported.
Author Contributions. O.B., D.J.M., and A.S. performed data analysis, interpreted the results, and wrote the manuscript. O.B., D.J.M., D.N.K., and J.E.S. designed the study. D.J.M., A.S., and J.E.S. supervised the application of the joint longitudinal-survival model and reviewed and edited the manuscript. D.J.M. and J.E.S. are the guarantors of this work and, as such, had full access to all of the data in the study and take responsibility for the integrity of the data and accuracy of the data analysis.
Prior Presentation. Parts of this study were presented at the 16th International Diabetes Epidemiology Group Symposium 2019, Seoul, Korea, 29 November–2 December 2019, and at the International Diabetes Federation Congress 2019, Busan, Korea, 2–6 December 2019.