


Hypoglycemic events during driving are life-threatening complications in people with type 1 diabetes (T1D). While preliminary studies showed increased glucose demand in driving simulations, we investigated interstitial fluid (ISF) glucose when driving under real-life circumstances.
We measured ISF glucose in 10 participants with stable T1D during a 2-h driving course using a continuous glucose monitoring system.
Our data show a driving-associated rise of ISF glucose. Initially increasing glucose was followed by decreasing values. Under control conditions at the same time of the day without driving, no specific glucose changes were observed.
Real-life driving may have caused an initial glucose increase followed by decreasing glucose values in this cohort with well-controlled T1D. These findings may be limited to the selected study population.
Introduction
Hypoglycemia during driving constitutes high risks for people with type 1 diabetes (T1D); consequently, both glucose demand and leveling are of vital interest (1–3). While elaborate computer-based driving simulations in people with T1D revealed an increased glucose demand during driving, these findings may not be translated in decreasing blood glucose (BG) under real-life circumstances (4). Ultimately, BG assessment during driving is indispensable, and we took advantage of a continuous glucose monitoring system (CGMS) to measure interstitial fluid (ISF) glucose during authentic driving performance (5).
Research Design and Methods
Participants
We examined 12 participants with stable T1D (HbA1c <7.5% and <10% variation in 6 months, optimized basal insulin during standardized training for flexible intensified insulin therapy [6] including an 18-h fasting test, no history of severe hypoglycemia in the past 12 months). Nine participants had childhood onset and three had adult-onset diabetes but no detectable C-peptide (<166 pmol/L, IMMULITE 2000 C-Peptide assay; Siemens AG, Munich, Germany). The study was approved by the local ethics committee, and all participants gave written informed consent. From 12 included participants, 10 data sets were analyzed. Two were excluded because of minor hypoglycemia requiring glucose ingestion prior to the driving experiment or sensor malfunction. In the 10 remaining participants (3 female and 7 male), the mean age was 46.4 years (range 26–60) with an average diabetes duration of 32.6 years (range 11–47). Insulin therapy encompassed insulin glargine/lispro (n = 4), insulin glargine/aspartat (n = 2), or insulin lispro applied by insulin pump (n = 4). Mean basal insulin was 0.22 units/kg (range 0.17–0.34).
Study Design
Day 1
The CGMS (Guardian REAL-Time monitor; Medtronic International Trading Sàrl, Tolochenaz, Switzerland) was installed and calibrated according to the manufacturer’s instructions (calibration two times per day, using capillary measurement for reference). Self-calibration was taught to each participant.
Day 2
Participants were instructed to consume their usual breakfast and to apply established doses of meal insulin before 8:00 a.m. as well as to avoid carbohydrate consumption afterward. They arrived at the hospital at 9:30 a.m. by car. After standardized questioning (e.g., timing of breakfast and insulin application), the driving course started at 10:00 a.m. (75 km urban/suburban areas, evenly distributed driving workload). Participants were blinded for the CGMS data. The accompanying investigator provided directions and glucose if necessary (<6 mmol/L) (7). The time of departure from home was calculated retrospectively using Google Maps (formula provided online in the Supplementary Data) (8). After driving, in order to reconfirm the previously reported 15-min delay of ISF glucose compared with capillary glucose (9), both were measured in parallel after ingestion of a standardized liquid meal (BOOST Original, Nestle S.A., Vevey, Switzerland) containing 41 g of carbohydrates.
Day 3
ISF glucose recorded during day 3 between 7:00 a.m. and 12:00 p.m. served as control. Equal rules applied as described for day 2, especially concerning insulin application, breakfast, and subsequent carbohydrate abstinence, with the additional condition to avoid driving and sports.
Statistical Analysis
Comparative glucose analyses were conducted using SPSS, version 21 (IBM Corp., Armonk, NY); P values were obtained from paired t test analysis. ISF glucose was corrected for its time lag of 15 min compared with capillary BG by shifting the original CGMS-obtained values 15 min (9). The corrected ISF glucose is henceforward called cISF glucose. Linear regression analysis was used to analyze correlation of capillary and cISF glucose. The mean absolute relative difference (MARD) was calculated as previously described (10).
Results
All participants confirmed that they complied with the prerequisites of the driving experiment, i.e., that breakfast was completed and insulin administered before 8:00 a.m. and that neither hypoglycemia occurred nor carbohydrates were consumed after breakfast. During a 2-h driving course, cISF glucose initially increased (Fig. 1A). The mean cISF glucose at start was 9.36 mmol/L (SEM 0.69). Subsequently, cISF glucose rose in all participants, reaching a peak after 35 min (10:00 a.m. vs. 10:35 a.m.: +0.401 mmol/L; SEM 0.09, P < 0.01). Comparative analysis showed decreasing cISF glucose toward the end of the driving course (10:00 a.m. vs. 12:00 p.m.: −0.876 mmol/L; SEM 0.38, P = 0.047; 10:35 a.m. vs. 12:00 p.m.: −1.29 mmol/L; SEM 0.42, P = 0.013), whereas no participant experienced hypoglycemia (Fig. 1C). Capillary glucose measurements showed a similar trend (10:00 a.m. vs. 12:00 p.m.: −0.900mmol/L; SEM 0.49, P = 0.098). However, cISF glucose recordings of the 3 h preceding the driving course showed rising glucose from around 9:00 a.m., correlating with the calculated individual departure time from home (Fig. 1A). It is possible that this increase was triggered by driving to the hospital. None of the above-mentioned cISF glucose excursions were observed between 7:00 a.m. and 12:00 p.m. on the control day (day 3) (10:00 a.m. vs. 12:00 p.m.: −0.359 mmol/L; SEM 0.584, P = 0.58) (Fig. 1B).
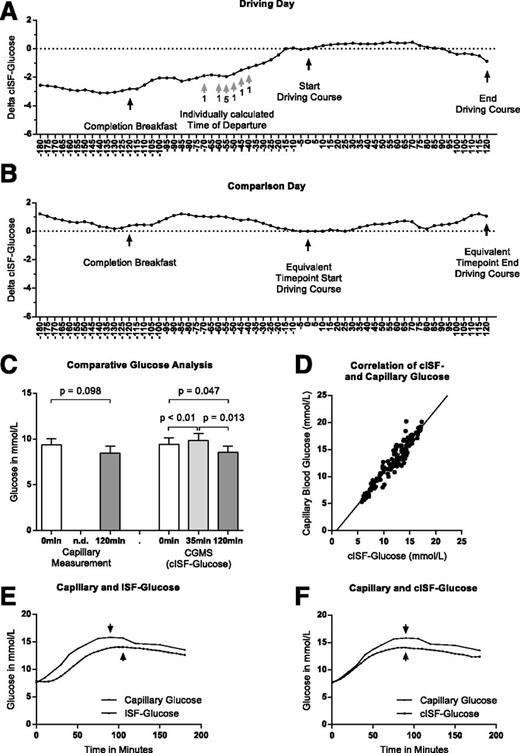
A and B: Median cISF glucose changes as a function of time between 7:00 a.m. and 12:00 p.m. relative to the cISF glucose level measured at the beginning of the driving course at 10:00 a.m. (cISF = ISF corrected for the 15-min time lag). The dotted straight lines are drawn through the start point of the driving course (A) or the corresponding time point (B). Panel A shows increasing cISF glucose, correlating with the individually calculated time points of departure from home (by car). After the start of the driving course, a further increase of cISF glucose is observed, which was, despite being smaller, shared by all participants. Subsequently, cISF glucose decreases toward the end of the driving course. The black arrows indicate landmarks including the deadline for finishing breakfast and insulin application and the beginning and the end of the driving course. The respective arrows are shown in panel B, where median cISF glucose excursion is shown for the control day, when participants did not drive and no significant changes were observed. The gray arrows in A indicate the individually calculated time points of departure from home. The digit below each gray arrow represents the number of participants who left home at the respective time. C: Mean and SEM of capillary BG values obtained before and after the driving course as well as cISF glucose at start, after 35 min, and after 2 h of driving. Capillary BG measurement shows a nonsignificant decreasing trend (start to end: −0.900 mmol/L; SEM 0.49, P = 0.098). Comparison of cISF glucose shows a significant increase followed by a significant decrease of cISF glucose (start to peak at 35 min: +0.401 mmol/L; SEM 0.09, P < 0.01) (peak to end: −1.29 mmol/L; SEM 0.42, P = 0.013) (start to end: −0.876 mmol/L; SEM 0.38, P = 0.047). P values are derived from paired t test analysis. D: Linear regression of capillary glucose vs. cISF glucose values, measured after ingestion of a liquid meal without application of meal insulin. R = 0.9027, slope = 1.168 ± 0.03726, y-intercept = −1.035. E and F: Mean capillary blood glucose (lines with dots) and the ISF glucose obtained by the CGMS (lines with squares) after ingestion of a liquid meal without application of meal insulin. The arrows indicate the peak glucose concentration of capillary and ISF glucose, respectively. While in panel E capillary BG is shown in comparison with uncorrected ISF glucose, panel F indicates capillary BG compared with cISF glucose values, which are corrected for 15 min of lag time.
A and B: Median cISF glucose changes as a function of time between 7:00 a.m. and 12:00 p.m. relative to the cISF glucose level measured at the beginning of the driving course at 10:00 a.m. (cISF = ISF corrected for the 15-min time lag). The dotted straight lines are drawn through the start point of the driving course (A) or the corresponding time point (B). Panel A shows increasing cISF glucose, correlating with the individually calculated time points of departure from home (by car). After the start of the driving course, a further increase of cISF glucose is observed, which was, despite being smaller, shared by all participants. Subsequently, cISF glucose decreases toward the end of the driving course. The black arrows indicate landmarks including the deadline for finishing breakfast and insulin application and the beginning and the end of the driving course. The respective arrows are shown in panel B, where median cISF glucose excursion is shown for the control day, when participants did not drive and no significant changes were observed. The gray arrows in A indicate the individually calculated time points of departure from home. The digit below each gray arrow represents the number of participants who left home at the respective time. C: Mean and SEM of capillary BG values obtained before and after the driving course as well as cISF glucose at start, after 35 min, and after 2 h of driving. Capillary BG measurement shows a nonsignificant decreasing trend (start to end: −0.900 mmol/L; SEM 0.49, P = 0.098). Comparison of cISF glucose shows a significant increase followed by a significant decrease of cISF glucose (start to peak at 35 min: +0.401 mmol/L; SEM 0.09, P < 0.01) (peak to end: −1.29 mmol/L; SEM 0.42, P = 0.013) (start to end: −0.876 mmol/L; SEM 0.38, P = 0.047). P values are derived from paired t test analysis. D: Linear regression of capillary glucose vs. cISF glucose values, measured after ingestion of a liquid meal without application of meal insulin. R = 0.9027, slope = 1.168 ± 0.03726, y-intercept = −1.035. E and F: Mean capillary blood glucose (lines with dots) and the ISF glucose obtained by the CGMS (lines with squares) after ingestion of a liquid meal without application of meal insulin. The arrows indicate the peak glucose concentration of capillary and ISF glucose, respectively. While in panel E capillary BG is shown in comparison with uncorrected ISF glucose, panel F indicates capillary BG compared with cISF glucose values, which are corrected for 15 min of lag time.
Parallel measurements of capillary BG and ISF glucose after ingestion of a standardized liquid meal showed an approximately 15-min delayed increase and peak of ISF glucose, confirming previous reports (9). Capillary BG and cISF glucose correlated closely (R = 0.9027, slope = 1.168 ± 0.03726, P < 0.0001) (Fig. 1D–F).
Conclusions
The impact of driving on glucose utilization had been addressed previously in well-designed driving-simulation studies using euglycemic clamp technology (4). In accordance with these findings, we observed decreasing cISF glucose and a trend of lower BG toward the end of the driving course. However, the present real-life study showed increasing cISF glucose during the initial 35 min of the driving course in all participants without exception. An even stronger driving-related increase of cISF glucose was shown in the analysis of the 3 h (7:00–10:00 a.m.) preceding the driving course. Glucose started to rise around 9:00 a.m., when many participants drove to the hospital, suggesting a driving-induced increase. However, even though all participants confirmed that they followed the study rules, it cannot be excluded that some individuals consumed more carbohydrates for breakfast, applied less insulin, or were particularly nervous in anticipation of the driving experiment. Importantly, the standardized meal test showed no evidence of delayed gastric emptying that could have caused a delayed glucose rise after breakfast. In comparison, no significant cISF glucose changes were observed during the control day, suggesting specific driving-related glucose variations. Prior studies showing elevated stress hormone concentrations during driving may explain the initially rising cISF glucose (11,12). The decreasing cISF glucose toward the end of the driving course may reflect higher glucose demand, which may outweigh the stress hormone–induced increase in time. Interestingly, previous work showed lower adrenalin release in response to low glucose during driving simulation in T1D subjects with a history of driving mishaps compared with those without (13). Our data suggest that the investigated T1D subjects (stable diabetes control, absence of a history with driving mishaps, and fasting-proven appropriate basal insulin) may not be at increased risk for hypoglycemia during short driving time but rather during longer driving time.
However, the present findings may not apply to the entire T1D population, especially those with higher HbA1c, more basal insulin, or frequent hypoglycemia. In the future, CGMS could help assess individual hypoglycemia risk during driving or serve as an alarm system.
One limitation of our study relates to the precision of CGMS. Parallel measurements of capillary BG and ISF glucose after a glucose challenge reconfirmed the previously described time lag of ISF glucose compared with capillary BG for the present cohort and a correction of 15 min appeared appropriate (Fig. 1E and F). The MARD is well established to assess the relationship between ISF glucose and capillary BG and to compare sensor accuracy between devices. The MARD in our study (MARD calculated from ISF glucose and capillary BG after liquid meal: 20.2%) matches previous reports of the presently used device (20.2 ± 6.8%) (14). Correction for the 15-min delay of the primary measured ISF glucose considerably improved the MARD (MARD calculated from cISF glucose and capillary BG after liquid meal: 9.2%) (Fig. 1E and F).
In summary, this pilot study suggests that real-life driving in a selected T1D population (stable glucose control, fasting-optimized basal insulin dose, negative history for severe hypoglycemia) may lead to temporarily increased glucose concentrations. This finding, however, does not question current driving guidelines advising frequent BG measurement before and during driving (7,14).
Article Information
Acknowledgments
The authors thank all the participants and the whole diabetes team of the University Hospital Basel for their support, especially Vreni Bättig, who installed and taught the handling of the CGMS to the majority of the participants.
Funding. This study was supported by the University Hospital Basel. The CGMS device (Guardian REAL-Time monitor) and disposable materials, including sensors, were provided by Medtronic International Trading Sàrl, Tolochenaz, Switzerland.
Duality of Interest. No potential conflicts of interest relevant to this article were reported.
Author Contributions. L.S.S. designed the research, performed the research, analyzed the data, and wrote the article. H.Z. designed the research, analyzed the data, and wrote the article. L.S.S. and H.Z. are the guarantors of this work and, as such, had full access to all the data in the study and take responsibility for the integrity of the data and the accuracy of the data analysis.
Prior Presentation. Parts of this study were presented in abstract form at the 75th Scientific Sessions of the American Diabetes Association, Boston, MA, 5–9 June 2015.
H.Z. is currently affiliated with Division of Endocrinology, Diabetes, and Porphyria, City Hospital Triemli, Zurich, Switzerland.
This article is featured in a podcast available at http://www.diabetesjournals.org/content/diabetes-core-update-podcasts.