


This study examined the effect of exenatide on brain activity measured by functional (f)MRI and on insulin secretion in lean and obese normal-glucose-tolerant individuals.
The brain fMRI signal in response to high-calorie-content food pictures was measured with and without intravenous exenatide infusion in 10 lean and 10 obese healthy volunteers. Insulin secretion was measured with a two-step (+100 and +200 mg/dL) hyperglycemic clamp with exenatide and with saline infusion.
The brain fMRI signal in response to food pictures in amygdala, insula, hippocampus, and frontal cortex was significantly greater in obese versus lean individuals. Intravenous exenatide significantly inhibited the fMRI signal in response to food pictures in obese individuals but did not affect the brain fMRI signal in lean subjects. Conversely, exenatide infusion caused an 18.5-fold increase in insulin secretion in lean individuals compared with an 8.8-fold increase in obese subjects. No significant correlation was observed between inhibition of the brain fMRI signal and increase in insulin secretion during exenatide infusion.
Exenatide causes greater augmentation in insulin secretion in lean compared with obese individuals but inhibits the brain response to food pictures only in obese individuals.
Introduction
Increased food intake plays a central role in the development of the obesity epidemic we are witnessing and is responsible for multiple public health problems, e.g., diabetes and cardiovascular disease (1–3). The brain, and the hypothalamus, in particular, plays a central role in the regulation of appetite and food intake by integrating neural, nutrient, and hormonal signals that converge directly and indirectly via neuronal circuits (4). The corticolimbic system, which is involved in the reward response, also affects appetite and food intake via connections to the hypothalamus (4). Studies with functional (f)MRI have demonstrated that visualizing pictures of high caloric food stimulates activity in several brain areas associated with the reward system, including the prefrontal cortex, nucleus accumbens, ventral striatum, insula, hippocampus, and amygdala (5,6). Further, the magnitude of the fMRI signal in these brain areas in response to visualizing pictures of high caloric food correlates with the BMI and predicted the magnitude of weight loss in a lifestyle intervention program (7).
Glucagon-like peptide 1 receptor agonists (GLP-1 RAs) are a class of antidiabetic drugs that, in addition to lowering the plasma glucose concentration, suppress appetite and promote weight loss (8). GLP-1 RAs strongly potentiate glucose-stimulated insulin secretion from the β-cell and inhibit glucagon secretion from the α-cell, both of which contribute to the glucose-lowering effect of this class of drugs. Studies in experimental animals and in people have demonstrated that the weight loss associated with GLP-1 RAs results from a central action to suppress appetite (9). Systemic GLP-1 RA administration in people promotes weight loss, and systemic and central administration of GLP-1 both reduce food intake in rodents (9). Conversely, blockade of the GLP-1 receptor with exendin 9-39 results in hyperphagia and attenuates satiety after a meal in rodents and in people (10,11). Clinical studies have demonstrated resistance to the action of GLP-1 RAs on pancreatic insulin secretion in patients with type 2 diabetes (12) and that the defect in insulin secretion can be improved by normalization/near normalization of the plasma glucose concentration with 4 weeks of intensive insulin therapy (13).
The aim of the current study was to compare the relationship between the central (brain) and pancreatic actions of GLP-1 RA activation in lean and obese individuals with normal glucose tolerance (13).
Research Design and Methods
Subjects
Two groups of subjects participated in the current study: 10 lean (BMI <26 kg/m2) and 10 obese (BMI >30 kg/m2) individuals with normal glucose tolerance. All subjects were in general good health and had normal liver, cardiopulmonary, and kidney function as determined by medical history, physical examination, screening blood tests, electrocardiogram, and urinalysis. Subjects had a normal oral glucose tolerance test (OGTT) result according to the American Diabetes Association (ADA) criteria. No subject was taking any medications, including over-the-counter medications, and all subjects had stable body weight during the 3 months preceding the study (±2 lb). No subject participated in an excessively heavy exercise program. Lean and obese subjects were matched for sex and age. The study protocol was approved by the University of Texas Health Science Center at San Antonio Institutional Review Board, and informed written consent was obtained from all subjects before their participation.
Research Design
After screening, eligible subjects received the following tests: 1) 75-g OGTT; 2) two-step hyperglycemic clamp with saline infusion; 3) two-step hyperglycemic clamp with intravenous exenatide infusion; and 4) fMRI measurement of brain activity in response to food cues before and during exenatide infusion. Tests were performed in a random order, and each test was performed on a separate day, 5–14 days apart, after a 10- to 12-h overnight fast.
OGTT
Before the start of the OGTT, a polyethylene catheter was placed into an antecubital vein, and blood samples were collected at −30, −15, and 0 min before and at 15, 30, 45, 60, 75, 90, 105, and 120 min after glucose (75 g) ingestion for measurement of plasma glucose and insulin concentrations. On the day of the OGTT, body weight and height were measured, and waist circumference was determined at the narrowest part of the torso
Hyperglycemic Clamp
All subjects received a two-step (+100 and +200 mg/dL above the fasting level) hyperglycemic clamp, with each step lasting 60 min (14). Before the start of the hyperglycemic clamp, a catheter was placed into an antecubital vein for the infusion of glucose. A second catheter was inserted retrogradely into a vein on the dorsum of the hand, and the hand was placed into a thermoregulated box heated to 60°C. After three baseline samples were obtained, plasma glucose concentration was acutely raised and maintained at 100 mg/dL above fasting level for 60 min by the adjustment of a variable infusion of 20% glucose. At 60 min, the plasma glucose concentration was acutely raised and maintained at 200 mg/dL above the fasting level for an additional 60 min. Blood samples were collected every 2 min from 0 to 10 min and every 10 min from 14 to 120 min for the measurement of plasma insulin concentration. Plasma glucose concentration was measured every 2 min during the first 14 min and every 5 min thereafter.
Brain Imaging
Brain response to food cues was measured with fMRI performed during the saline and exenatide infusion. In preliminary experiments, we observed a decrease in fasting plasma glucose concentration in response to the intravenous exenatide infusion. Therefore, during brain imaging studies, the plasma glucose concentration was clamped at the subject’s fasting plasma glucose level.
All subjects reported to the Research Imaging Institute at 8:00 a.m. after a 10- to 12-h overnight fast. A catheter was placed into an antecubital vein for the infusion of glucose. A second catheter was inserted retrogradely into a vein on the dorsum of the hand for blood withdrawal, and the hand was placed into a thermoregulated box heated to 60°C. Before the saline or exenatide infusion, brain activity was measured with fMRI in response to food cues and nonfood-containing pictures. After the baseline data collection (time 0) was completed, a prime (0.3 μg over 1 min) continuous (0.05 μg/min) infusion of exenatide was started, and at 30 min, brain fMRI signal in response to food cues was repeated. We previously have shown (15) that this exenatide infusion rate produces plasma exenatide concentrations similar to peak plasma exenatide levels after a 10 μg subcutaneous injection of exenatide, and there was no relationship between BMI and plasma exenatide concentration. In a prior study (16) we demonstrated that the effect of exenatide on cerebral glucose metabolism was observed within 30 min after a 5 μg subcutaneous exenatide injection. During the exenatide infusion, the plasma glucose concentration was measured every 5 min, and a variable dextrose (20%) was infused to maintain the plasma glucose concentration at the fasting level.
Visual Stimulation Paradigm
Three types of visual stimuli were used: food images, nonfood images, and a blank screen. The food images were popular, high-calorie-content foods, including cheeseburgers, hot dogs, French fries, cake, cookies, and ice cream. Nonfood images were outdoor landscape scenes, including mountains, lakes, rivers, trees, and flowers. The blank screen was uniformly black, with a fixation cross. Subjects were instructed to fixate on the cross, when present, and to maintain fixation to the center of the screen when the cross was not present. No other task was required. Stimulus presentation and image-data acquisition was in block-design format, with one type of stimulus presented in each 30-s block. Stimulus-presentation time was synchronized with image repetition time (TR), at 3 s per image. Thirty 30-s blocks (10 images/block)—10 blocks of food images, 10 blocks of nonfood images, and 10 blocks of black background—were shown to each subject over an acquisition period of 15 min. Stimuli were presented via a Windows computer running E-prime 2.0 software (Psychology Software Tools, Sharpsburg, VA). Images were back-projected onto a translucent screen located at the back of the scanning bed and were visible via a mirror mounted on the head coil. To avoid habituation, individual pictures did not repeat within or between acquisition blocks.
Image Acquisition
All image data were acquired with a 3-Tesla, research-dedicated Siemens TIM/TRIO (Erlangen, Germany) at the Research Imaging Institute. Each participant’s head was secured with foam padding and a chin holder to minimize head motion. For anatomic localization and spatial normalization, a three-dimensional, high-resolution, T1-weighted anatomical MRI was obtained (TR = 2,200 ms, echo time = 2.72 ms, inversion time = 766 ms, flip angle = 13°, and resolution of 1 × 1 × 1 mm). Thereafter, whole-brain T2* blood oxygen level dependent effect (BOLD) fMRI volumes were acquired using Echo Planar Imaging (EPI) at TR = 3,000 ms, echo time = 30 ms, an in-plane spatial resolution of 1.7 × 1.7 mm, as 3-mm-thick sagittal slices. Each BOLD acquisition contained 310 time points (310 volumes) obtained over 15 min.
Image Data Analysis
Functional imaging data were preprocessed and analyzed using the FSL 4.1.6 analysis package, distributed by the Oxford Centre for Functional MRI of the Brain (http://www.fmrib.ox.ac.uk/fsl/). Raw data were corrected for head motion and spatially smoothed using a nonisotropic Gaussian kernel (full width half maximum = 5 mm) with a high-pass filter of 100 s. Statistical contrasts were performed within the general linear model construct, with a Z-score threshold >2.3, with correction for multiple comparisons by Gaussian random field modeling. Voxel-wise contrasts were performed for the food versus nonfood conditions per condition and per group, as follows: 1) lean pre-exenatide; 2) lean postexenatide; 3) obese pre-exenatide; and 4) obese postexenatide. These contrasts were used to confirm the overall performance of the visual-food-cue paradigm at eliciting food cue–specific responses per group. Voxel-wise statistical contrasts were performed using the MNI-152 template and then transformed into Talairach space (17) for automated anatomical labeling (15) and interpretation. A priori regions of interest (ROIs) (i.e., right insula, left insula, right amygdala, hypothalamus, right hippocampus, and frontal cortex) were determined based on previous studies (18,19).
Data Analysis and Statistical Methods
First-phase insulin secretion during the first step of the hyperglycemic clamp was calculated as the mean increment in plasma insulin concentration between 0 and 10 min (ΔI0–10) (14). Second-phase insulin secretion during the first step of the hyperglycemic clamp was calculated as the mean increment in plasma insulin concentration between 10 and 60 min. Insulin secretion during the second step of the hyperglycemic clamp was calculated as the mean increment in plasma insulin concentration between 60 and 120 min (ΔI60–120). The effect of exenatide on insulin secretion was calculated as the ratio of the increment in plasma insulin concentration during the hyperglycemic clamp (ΔI10–120) with versus without exenatide. The mean glucose infusion rate divided by the mean plasma insulin concentration during specific time points was calculated as an index of whole-body sensitivity to insulin.
Data are presented as the mean ± SE. Simple Pearson correlation was used to assess the relationship among variables. Statistical significance was considered at P < 0.05.
Analytical Techniques
Plasma glucose was measured by the glucose oxidase reaction (Glucose Oxidase Analyzer; Beckman, Fullerton, CA). Plasma insulin concentration was measured by radioimmunoassay (Linco Research, St. Louis, MO). Plasma glucagon was measured by radioimmunoassay (EMD Millipore Corp., Chicago, IL).
Results
Table 1 presents the baseline characteristics of the study participants. Lean and obese subjects were matched in age, sex, and fasting plasma glucose concentration. Although obese subjects had a slightly higher 2-h plasma glucose concentration (114 ± 4 vs. 94 ± 8 mg/dL, P = 0.03), all subjects had normal glucose tolerance according to the ADA criteria. As per study design, obese individuals had a markedly greater BMI (33.1 ± 1.1 kg/m2) than lean individuals (23.9 ± 0.8, P < 0.0001). As expected, obese individuals had a significantly higher fasting plasma insulin concentration and a significantly lower glucose infusion rate during the hyperglycemic clamp (Table 1).
Baseline characteristics
| Lean | Obese | P value | |
|---|---|---|---|
| Age (years) | 44 ± 6 | 45 ± 5 | NS |
| Sex (% male) | 44 | 50 | NS |
| BMI (kg/m2) | 23.9 ± 0.8 | 33.1 ± 1.1 | <0.0001 |
| Plasma glucose | |||
| Fasting (mg/dL) | 95 ± 2 | 94 ± 2 | NS |
| 2-h (mg/dL) | 94 ± 8 | 114 ± 4 | 0.03 |
| Fasting plasma insulin (µU/mL) | 3.1 ± 1.6 | 14.0 ± 7.1 | <0.05 |
| GIR (100)/MPI | |||
| First step (mg/kg ⋅ min) | 26.9 ± 2.6 | 9.3 ± 1.6 | 0.0001 |
| Second step (mg/kg ⋅ min) | 30.4 ± 4.2 | 8.6 ± 1.5 | 0.0003 |
GIR, glucose infusion rate; MPI, mean plasma insulin concentration during hyperglycemic clamp performed with saline.
Effect of Exenatide Infusion on Insulin Secretion in Lean and Obese Individuals
Compared with lean subjects, obese individuals had significantly greater first-phase insulin secretion as measured by the incremental area under the plasma insulin concentration during the first 10 min of the hyperglycemic clamp (∆I0–10) (8.0 ± 2.2 and 3.1 ± 0.4 µU/mL, P < 0.05) performed with saline infusion. Similarly, ∆I(10–60) and ∆I(60–120) were significantly greater in obese individuals than in lean individuals (Table 2).
Effect of exenatide on the incremental area under the plasma insulin concentration curve (μU/mL) during the hyperglycemic clamp
| Saline | Exenatide | Exenatide/saline | |
|---|---|---|---|
| Lean | |||
| 1st phase, ∆I(0–10) | 3.1 ± 0.4 | 12.7 ± 2.1 | 4.4 |
| 2nd phase, 1st step, ∆I(10–60) | 12.9 ± 1.4 | 206 ± 41 | 18.6 |
| 2nd phase, 2nd step, ∆I(60–120) | 32.5 ± 4.5 | 582 ± 66 | 21.6 |
| Total ∆I(0–120) | 48 ± 6 | 801 ± 107 | 18.5 |
| Obese | |||
| 1st phase, ∆I(0–10) | 8.0 ± 2.2* | 22 ± 2 | 4.2 |
| 2nd phase, 1st step, ∆I(10–60) | 42.6 ± 9.6* | 339 ± 71 | 13.1** |
| 2nd phase, 2nd step, (60–120) | 128.5 ± 33* | 756 ± 94 | 9.3** |
| Total ∆I(0–120) | 179 ± 44* | 1,116 ± 152 | 8.8** |
*P < 0.05 vs. lean subjects.
**P < 0.01 vs. lean subjects.
Plasma glucose concentration was clamped at the fasting level (96 ± 1 µU/mL) during exenatide infusion. However, despite euglycemia, exenatide infusion stimulated insulin secretion and suppressed glucagon secretion in both obese and lean individuals. Exenatide infusion caused a marked increase in insulin secretion in both obese and lean individuals (Fig. 1). The incremental area under the plasma insulin concentration during the hyperglycemic clamp increased from 48 to 801 µU/mL ⋅ h after exenatide infusion in lean individuals and from 179 to 1,116 µU/mL ⋅ h in obese subjects. Thus, exenatide caused an 18.5-fold increase in ∆I0–120 during the hyperglycemic clamp in lean individuals compared with an 8.8-fold increase in obese individuals (P < 0.05). During exenatide infusion, the fasting plasma glucagon declined similarly in lean (39 ± 3 to 35 ± 3 pg/mL, P < 0.05) and obese (41 ± 3 to 37 ± 3 pg/mL, P < 0.05) individuals.
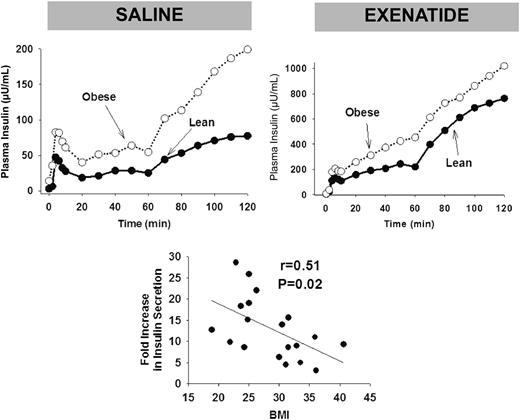
Plasma insulin concentrations during the hyperglycemic clamp in lean and obese individuals during saline infusion (top left) and during exenatide infusion (top right). Note the expanded scale for plasma insulin response after exenatide infusion (top right). The relationship between the fold-increase in insulin secretion during the hyperglycemic clamp during the exenatide infusion relative to baseline vs. BMI is shown on the bottom.
Plasma insulin concentrations during the hyperglycemic clamp in lean and obese individuals during saline infusion (top left) and during exenatide infusion (top right). Note the expanded scale for plasma insulin response after exenatide infusion (top right). The relationship between the fold-increase in insulin secretion during the hyperglycemic clamp during the exenatide infusion relative to baseline vs. BMI is shown on the bottom.
Brain Response to Food Pictures in Lean and Obese Individuals
Brain activity, measured with fMRI in response to food pictures with high caloric value, was greater in obese individuals than in lean individuals in multiple brain areas associated with the reward system (Fig. 2). The difference in brain fMRI signal in response to food pictures between obese and lean groups was statistically significant in the left insula, right amygdala, right hippocampus, and frontal cortex (Fig. 2). Interestingly, the fMRI signal in the hypothalamus, which plays a central role in the regulation of food intake, was significantly greater in lean individuals compared with obese individuals (P < 0.05).

The fMRI signal (Z-score) in lean and obese individuals during the saline infusion.*P < 0.05.
The fMRI signal (Z-score) in lean and obese individuals during the saline infusion.*P < 0.05.
Effect of Exenatide Infusion on fMRI Signal in Response to Food Pictures
Exenatide infusion caused a significant decrease in the fMRI signal in response to food pictures in the left insula, right amygdala, right hippocampus, and frontal cortex in obese subjects (Fig. 3). However, exenatide infusion did not affect the fMRI signal in any brain area in lean individuals. In obese subjects, exenatide infusion caused an increase in the hypothalamic fMRI signal but had no effect in lean individuals. Thus, during exenatide infusion, the brain fMRI signal in response to food pictures in the hypothalamus and other brain areas associated with the reward system was comparable in lean and obese individuals.

The effect of exenatide and saline infusion on the fMRI signal (Z-score) in the left insula and amygdala in obese individuals. *P < 0.05.
The effect of exenatide and saline infusion on the fMRI signal (Z-score) in the left insula and amygdala in obese individuals. *P < 0.05.
No correlation was found between the increase in plasma insulin signal and the decrease in the plasma glucagon signal versus the fMRI signal in any of the brain regions. There was no significant correlation between the magnitude of increment in insulin secretion caused by exenatide infusion during the hyperglycemic clamp and the effect of exenatide on fMRI signal in any brain area.
Conclusions
The major finding of the current study is that the pancreatic and central (brain) actions of the GLP-1 RA exenatide are very different in obese versus lean individuals. Although exenatide infusion enhanced glucose-stimulated insulin secretion from the β-cells in both lean and obese individuals, exenatide failed to exert any stimulatory (amygdala, insula, hippocampus, frontal cortex)/inhibitory (hypothalamus) effects on specific brain areas involved in the regulation of food reward and appetite in lean subjects, whereas robust effects on brain fMRI signal in response to food pictures were observed in obese subjects.
Exenatide infusion caused a marked increase in insulin secretion during the hyperglycemic clamp in lean individuals (18-fold increase), whereas the augmentation of insulin secretion by exenatide in obese individuals was attenuated by approximately one-half (∼9-fold increase), suggesting resistance to exenatide action on the β-cell in obese individuals. This suggests that obesity is associated with decreased ability of GLP-1 RA activation to augment glucose-stimulated insulin secretion.
Moreover, exenatide infusion stimulated insulin secretion at euglycemic conditions during the fMRI study, and similar to hyperglycemic conditions, the increase in plasma insulin concentration caused by exenatide was twofold greater in lean compared with obese individuals. Previous studies have demonstrated resistance to the pancreatic action of GLP-1 RAs in individuals with type 2 diabetes is partly acquired secondary to chronic hyperglycemia (13). Correction of the plasma glucose concentration with 4 weeks of intensive insulin treatment partly restored the β-cell responsiveness to GLP-1 RAs (13). All participants in the current study had a normal OGTT result according to the ADA criteria. Thus, the decreased efficacy of GLP-1 RA on insulin secretion with increasing in BMI cannot be attributed to hyperglycemia. It could be argued that the decreased β-cell responsiveness to exenatide in obese individuals is part of a more global defect in β-cell function. Against this, however, is the normal increase in plasma insulin response as well as the increased ΔI/ΔG response during the OGTT and during the hyperglycemic clamp.
Although the magnitude of the insulin secretory response to intravenous glucose (hyperglycemic clamp) was reduced in obese compared with lean individuals, exenatide clearly exerted a significant action to augment insulin secretion in the obese group. In marked contrast, the ability of exenatide to affect brain activity (measured by fMRI) in multiple areas of the central nervous system was completely absent in lean, normal-glucose-tolerant individuals. Consistent with previous studies (20,21), obese individuals manifested an accentuated brain fMRI signal in response to food pictures of high caloric density compared with lean subjects in brain areas (insula, hippocampus, amygdala, frontal cortex) that have been shown to be associated with the reward system. However, unlike its stimulatory effect in obese subjects on brain areas involved with food reward, exenatide markedly inhibited the hypothalamic fMRI signal in obese individuals but had no significant effect on the hypothalamic fMRI signal in lean subjects.
In a previous study, van Bloemendaal et al. (20) attributed their inability to detect a significant action of exenatide on the brain fMRI signal in lean individuals to the small size of the signal. Although this possibility cannot be excluded, we were able to detect a significant effect of exenatide on the fMRI hypothalamic signal in obese individuals. Further, the fMRI signal was reduced during exenatide infusion in the obese group and became comparable to that in lean individuals. We therefore believe that the exenatide infusion “corrected the abnormal” fMRI signal in obese individuals.
Our results demonstrate a clear dissociation between the stimulatory action of exenatide on insulin secretion and the complete lack of effect of exenatide on brain areas involved in the regulation of food intake in lean subjects. No correlation was observed between stimulation of insulin secretion and the effect of exenatide on brain fMRI signal. Of note, the effect of exenatide on fMRI activity in the hypothalamus was opposite to that in other brain areas associated with the reward system. Obese individuals had a smaller hypothalamic fMRI signal in response to food cues than lean subjects, and exenatide infusion enhanced the hypothalamic fMRI signal. Consistent with this, we (22) previously demonstrated a diminished hypothalamic fMRI signal in response to glucose ingestion in obese individuals compared with lean individuals. Thus, it is possible that the fMRI signal measured in the hypothalamus represents an inhibitory signal that suppresses food intake and that this signal is attenuated in obese compared with lean individuals. The fMRI signal in response to food cues in obese subjects during exenatide infusion was similar to that in lean subjects during saline infusion.
The brain signal (amygdala, insula, hippocampus, frontal cortex) measured with fMRI in response to pictures with high caloric food value is thought to represent a neural response that stimulates the appetite, and its suppression with GLP-1 RAs has been postulated to represent a central appetite-suppressant effect that promotes weight loss. Consistent with this scenario, subjects with a greater fMRI response to pictures of high caloric food had greater difficulty in losing weight in a lifestyle intervention program (7). However, despite lack of significant effect of exenatide infusion on brain fMRI activity in lean, normal-glucose-tolerant individuals, clinical studies have demonstrated that GLP-1 RA treatment in patients with type 2 diabetes causes weight loss in lean as well as in obese individuals (23).
The current study has some limitations. Plasma exenatide concentrations were not measured during the exenatide infusion. Differences in exenatide clearance rate and/or exenatide distribution in the plasma volume between lean and obese individuals could have resulted in lower plasma exenatide concentrations in obese individuals and contributed to the attenuation of the pancreatic effect of exenatide with increasing BMI. However, because exenatide clearance is primarily renal, all participants had normal renal function, and the estimated glomerular filtration rate was comparable in lean and obese individuals (119 vs. 123 mL/min), it is unlikely that the plasma exenatide concentration varied significantly between the two groups. Moreover, the exenatide infusion exerted a greater effect on the brain fMRI signal in obese versus lean individuals, which argues against the possibility of lower plasma exenatide concentrations in the obese group. Another limitation is that exendin 9-39 was not used to confirm the specificity of the exenatide effects in the current study. Because only lean and obese subjects without diabetes were included in the current study, extrapolation of results from normal-glucose-tolerant subjects to those with diabetes is not warranted.
Article Information
Acknowledgments. The authors thank Sandra Martinez, RN, for her excellent care of the patients during the study and Lorrie Albarado and Shannon Balmer, from the University of Texas Health Science Center, for their expert secretarial assistance in preparation of the manuscript.
Funding. The salary received by R.D. is partly supported by the South Texas Veterans Health Care System. This study was partly supported by Qatar Foundation grant NPRP 4-248-3-076 and National Institutes of Health grant ROI DK097554-01 to M.A.-G. Exenatide was provided by AstraZeneca.
Duality of Interest. R.D. is on the advisory boards of AstraZeneca, Novo Nordisk, Janssen, Intarcia, and Boehringer Ingelheim; receives research support from Bristol-Myers Squibb, Boehringer Ingelheim, Takeda, and AstraZeneca; and is on the speaker's bureaus of Novo Nordisk and AstraZeneca. No other potential conflicts of interest relevant to this article were reported.
Author Contributions. R.E., G.D., C.H., M.A.-A., and J.A. generated the data. G.D., T.D., and J.L. contributed to data analysis. R.D., M.Z., and A.J. reviewed and revised the manuscript. M.A.-G. designed the study, wrote the protocol, contributed to data generation and data analysis, and wrote the manuscript. M.A.-G. is the guarantor of this work and, as such, had full access to all the data in the study and takes responsibility for the integrity of the data and the accuracy of the data analysis.