


Disease-associated T-cell autoreactivities are seen in most type 1 diabetic patients and are thought to emerge before islet autoantibodies, but host factors that impact autoimmune elements remain uncertain. We assessed if adiposity and measures of insulin sensitivity impact T- and B-cell autoimmunity in children with insulin-requiring diabetes.
Insulin-requiring children and adolescents diagnosed between January 2004 and June 2008 were studied (n = 261): age 9.7 ± 4 years, 92% white, and 60% male. T-cell responses to 10 diabetes-associated antigens, β-cell autoantibodies (GADA, IA-2A, IAA, and ICA), BMI z score (BMIz), and waist percentile were measured at onset and 3 months later.
All but one subject had either T- or B-cell autoimmunity. Diabetes-associated T-cell autoreactivities were found in 92% of subjects. Higher amplitude T-cell autoreactivities to neuronal diabetes-associated autoantigens were seen in those with the highest BMIz quintile, BMI ≥85th percentile (P < 0.05), and waist circumference ≥85th percentile (P < 0.05). There were no relationships between the number of T-cell reactivities or T-cell diversity with adiposity measures or autoantibody number or type. Patients with positive T-cell reactivities but without autoantibodies had the highest BMIz (P = 0.006).
Our observations link obesity and diabetes-related autoimmunity, suggesting an amplification of neuronal T-cell autoimmunity associated with adiposity and/or insulin resistance, with obesity-related inflammation possibly enhancing islet autoimmunity.
Introduction
Type 1a diabetes is defined by autoimmune-mediated β-cell dysfunction and destruction (1). Immune markers of autoimmune diabetes have historically centered on the presence of serum autoantibodies to islet antigens (2) as markers of autoimmune destruction and physiological mediators of lesion repair (3). However, in 5–15% of new-onset type 1 diabetic patients, conventional islet autoantibodies are absent (4–6), similar to many first-degree relatives (FDRs) with high-risk HLA haplotypes who develop diabetes (7). Diabetes-selective T-cell reactivities to islet cell, neuronal, and environmental analytes are present at onset of type 1 diabetes (8). Similar diabetes-selective T-cell reactivities to islet cell proteins have been demonstrated in children (9) and adults with clinical type 2 diabetes regardless of autoantibody status (10) and have been associated with significantly low C-peptide levels in adults (10). Similar T-cell findings have been documented in type 1 diabetes–prone NOD mice (11) and B6 mice with diet-induced obesity, as well as in obese adults with the metabolic syndrome or clinically diagnosed type 2 diabetes (12). Each of these studies documents an adipose tissue–based, but ultimately systemic, autoimmune response (13).
The global rise of obesity is mirrored in cohorts of pediatric type 1 diabetes (14,15), contemporaneous with increasing type 1 diabetes incidence and earlier age at onset associated with enhanced weight gain (16,17). The concept of excess weight gain with associated insulin resistance as type 1 diabetes risk factors remains unproven but has been proposed by the “accelerator hypothesis” to precede and initiate β-cell damage (18). Our alternative hypothesis proposes environmentally (e.g., viral or toxin) induced initial autoimmune β-cell damage with progressively declining ability to meet the increased insulin demands of obesity-related insulin resistance and consequent presentation of clinical diabetes with less severe β-cell loss and fewer β-cell autoantibodies at onset (19,20). Adiposity has been recognized to generate a generalized proinflammatory milieu (13,21,22), which can promote progression of autoimmune processes. An example of this phenomenon is the association between obesity and earlier multiple sclerosis presentation (23), a classical, cognate autoimmune disorder with many analogies to type 1 diabetes (24).
Due to scarce mechanistic understanding of the immunometabolic interface in pediatric diabetes, our aim is to assess if adiposity and surrogate measures of insulin resistance impact T- and B-cell autoimmunity in normal and overweight children with insulin-requiring diabetes. This study demonstrates associations between enhanced neuronal T-cell autoreactivity and obesity in children with clinical type 1 diabetes.
Research Design and Methods
Study Population
Children <19 years of age with insulin-requiring diabetes, diagnosed consecutively from January 2004 to June 2008 at Children’s Hospital of Pittsburgh, were recruited for consent and enrollment in the study. All clinical data were obtained within 1 week of diagnosis and at initial follow-up, 2–3 months later. Blood for measures of autoimmunity was drawn 3–5 days after onset when metabolic control had been established and/or 3 months later. Of 351 patients recruited for the study, 287 had T-cell results available and 261 had sufficient serum for measurements of three to four autoantibodies (Supplementary Fig. 1). Therefore 261 patients were analyzed: age 9.7 ± 4 years (range 1.2–18.9); 60% male; and 92% Caucasian, 6% African American, and 2% “other” (Table 1). There were no differences in mean hemoglobin A1c (HbA1c), BMI z score (BMIz), sex, race, or serum C-peptide levels between the included (n = 261) and excluded (n = 90) subjects. The excluded group was slightly younger, with a mean age of 7.7 years (P = 0.03), because of difficulty obtaining sufficient research blood volume in small patients. BMI percentiles and BMIz were calculated using the Centers for Disease Control and Prevention 2000 growth data.
Comparison of new-onset diabetic patients and control subjects
| Diabetic patients (n = 261) | Control subjects (n = 45) | P | |
|---|---|---|---|
| Age (years), mean (SD) | 9.7 (±4.0) | 10.6 (±5.1) | 0.34 |
| Race (% white) | 92 | 95 | 0.09 |
| Sex (% male) | 60 | 53 | 0.14 |
| BMIz median (IQR) | 0.83 (0.26–1.5) | 0.86 (0.23–1.66) | 0.77 |
| WC (cm), median (IQR) | 65 (57–73) | 65 (56–77) | 0.62 |
| Number of positive analytes, median (IQR) | 10 (9–10) | 0 (0–0) | <0.001 |
| HLA DQ2 and/or DQ8 (%) | 81 | 0 | <0.001 |
Waist circumference (WC) measurement corrected for age and BMIz was used as a surrogate measure of insulin resistance (25). As most children with new-onset type 1 diabetes regain prediagnosis weight loss by the initial follow-up visit (2–3 month), BMI and WC measures were analyzed at that time to approximate prediagnosis habitus. Waist measurement was not available for 60 patients. There were no differences in age, race, sex, HbA1c, or BMI between the 201 subjects with and 60 subjects without available waist measurements.
Autoantibody Assays
Anti-GAD and -IA-2 autoantibodies were assayed in triplicate using in vitro–translated/transcribed [35S]methionine-labeled human GAD65 and IA-2/BDC, the latter containing the intracellular domains (26). Insulin autoantibodies were measured using a 125I-labeled insulin assay with precipitation of IgG by protein A (27) only in samples obtained within 1 week of insulin treatment (n = 93). ICA was measured using both human group O and cafeteria-fed rat pancreas substrates by immunohistochemistry (28). Based on the 97th percentile of controls, positive ICA was defined as ≥5 JDFU for human and ≥10 JDFU for rat substrates. ICA measured on rat pancreas (ICA-R) has been postulated to be an early marker of diabetes (26), and therefore data are included for subjects negative for conventional autoantibodies. In those individuals without positive classical autoantibodies, ZnT8 autoantibodies were measured (29).
These assays have been assessed repeatedly in proficiency workshops organized by the University of Florida, Gainesville (1995, 1996, and 1997), and the Diabetes Autoantibody Standardization Program (2000, 2003, 2005, 2007, and 2010): GAD65 76–100% sensitivity, 90–100% specificity (100% specificity three times), and 100% validity; IA-2 48–84% sensitivity, 98–100% specificity, and 87.5% validity; and ICA and ICA-R sensitivity and specificity between 80 and 100%. Sensitivity and specificities were 60 and 93% for IAA and 64 and 100% for ZnT8 autoantibodies, respectively.
T-Cell Proliferation Assay
Blood samples for T-cell assays were collected in preservative-free heparin, blinded, and shipped to Toronto by overnight courier in uncooled Styrofoam boxes. A diabetic sample was sent regularly as a positive control for the assays as well as samples from nondiabetic FDRs. Viable peripheral blood mononuclear cells were enriched on Ficoll-Hypaque gradients, and 1 × 10⁵ cells/flat-bottom microculture well were incubated in 200-μL serum- and protein-free Hybri-Max 2897 medium (Sigma-Aldrich, St. Louis, MO) with or without 0.005–10 μg/mL of the test protein and peptide antigens (see below). The various test antigens (“analytes,” 20 µL in medium) were preloaded to replicate dry wells prior to addition of other noncellular culture ingredients and stored frozen until used. Recombinant human IL2 (10 units) was added to test analytes to detect anergic T cells (8). After 6 days, cultures were pulsed overnight with 1 µCi [3H]thymidine, harvested, and submitted to scintillation counting. Data were calculated as average counts per minute (cpm) and mean stimulation indices (SI, cpm test/cpm unstimulated culture). A positive response was identified as SI ≥3 SD above the mean of ovalbumin-stimulated responses, which corresponded to an SI >1.5 in 98 ± 1% of viable samples (8). Tetanus toxoid stimulation was used as a nonautoimmunity-related positive control. Positive T-cell reactivity was considered to be reactivity to four or more analytes, previously shown to reliably distinguish diabetic from unrelated control subjects (8) with confirmation of the efficacy of this assay in blinded, national T-cell assay workshops (30,31). This assay provides comparable results to those of the “Seattle assay,” despite rather different assay technologies or relatively lower SIs (31). Supplementary Table 1 lists the 10 previously identified diabetes-associated test antigens and two positive and two negative controls.
Molecular Typing of HLA Alleles
Molecular HLA typing was carried out using sequence-specific priming and exonuclease-released fluorescence, as previously described (32). This methodology involves designing and purifying double-labeled fluorescent probes for the detection of class I and class II alleles in PCR-amplified DNA samples without the need of agarose gels for reading results.
C-Peptide
Serum C-peptide levels were obtained at diabetes presentation prior to first insulin administration (measured by the clinical laboratory assay [Advia Centaur; Siemens]), with lower limit of detection of 0.5 ng/mL, and again, postprandially, 1–2 h after a nonstandard meal, at the first follow-up visit. All correlations were performed with this 2–3-month remission sample assayed in the research laboratory using a human C-peptide radioimmunoassay kit (Linco Research, St. Charles, MO) with a lower detection limit of 0.1 ng/mL and linearity to 5.0 ng/mL. Levels of >5.0 ng/mL were remeasured using dilutions. Inter- and intra-assay coefficients of variation were 0.047 and 0.046, respectively. Assay results below the level of detection were replaced with the midpoint between 0 and the lower limit of detection. (e.g., 0.25 for values at diagnosis and 0.05 for values obtained at follow-up visits).
Data Analyses and Statistics
Data were summarized using means and SDs or median and interquartile range for continuous variables and frequencies for discrete variables. The distributions of variables were assessed for normality. Student t tests were used to compare means of two groups of continuous variables. ANOVA was used to compare multiple means of continuous, normally distributed variables, and ANCOVA was used when controlling for other variables in the comparison. χ2 Test was used to compare frequencies of categorical variables and Fisher exact test with less than five expected counts. Wilcoxon rank sum test and median tests were used to compare medians of nonparametric data with equal and unequal variance, respectively, and Kruskal-Wallis test was used when comparing multiple means of nonparametric data. Multiple linear regression analysis was performed to assess the contribution of each variable. Pearson and Spearman correlations were used for correlation studies for parametric and nonparametric data, respectively. There was no statistical difference in the immune markers collected at the 0- and 3-month time frames (see results); therefore, these samples were combined to increase the power of multivariate analyses. All statistical analyses were performed using SAS version 9.3 (SAS Institute, Cary, NC), and significance was set to 5%.
Results
T-Cell Responses in Diabetic Patients
All 261 diabetic patients responded to the positive control antigens, whereas 240 (92%) demonstrated positive T-cell reactivity (four or more responses), with the vast majority of patients (217 of 261, 83%) showing positive reactivities to 9 or 10 of the test analytes (Table 2). Negative T-cell reactivities (less than four responses) were seen in 21 (8%) patients with zero (n = 19) or one (n = 2) reactivities to the analytes. There was not a significant difference in the response to control antigens in those with negative T-cell responses compared with those with positive T-cell responses. T-cell reactivities at onset were measured after diabetes was controlled, 3–5 days after diagnosis (57 patients) or at the 2–3-month follow-up visit (219 patients). T-cell responses were measured at both time points in 15 patients. There were no differences in median T-cell SI or number of positive T-cell reactivities in samples collected at diagnosis compared with the initial follow-up: median SI 1.8 (IQR 1.6–2) and median positive responses 10 (IQR 9–10) at each time. Fifteen subjects had available T-cell data at both 0 and 3 months, with median number of positive responses 10 (9–10) and 10 (9–10), respectively (P = 0.4), and no difference in median SIs at the two time points.
BMIz, WC, and number of positive islet autoantibodies do not affect the diversity of T-cell autoreactivity (P values adjusted for age)
| Negative T-cell response (<4) | Weak positive T-cell response (4–8) | Strong positive T-cell response (9–10) | P | |
|---|---|---|---|---|
| n (%) | 21 (8) | 23 (9) | 217 (83) | |
| BMIz, mean (SD) | 0.67 (1.1) | 0.3 (0.7) | 0.93 (0.9) | 0.06 |
| WC (cm), mean (SD) | 67 (8) | 62 (18) | 68 (15) | 0.64 |
| Number of positive autoantibodies, median (range) | 2 (0–4) | 2 (0–4) | 2 (0–4) | 0.2 |
T-Cell Responses in Control FDRs
All FDR siblings had expected reactivities to the control antigens, with no significant difference in SIs to control antigens between the diabetic patients and control subjects (Supplementary Table 1) but with significantly higher SI in the diabetic group for all diabetes antigens. There were significantly fewer positive T-cell reactivities to diabetes-associated analytes in FDRs compared with diabetic patients with only 5 of 45 (11%) FDRs having positive T-cell reactivities (Table 1). Islet autoantibodies were negative in these five individuals with positive T-cell reactivities (8–10 responses spanning all T-cell categories), and three of the five were obese (BMIz range +2.07 to +2.7). There were no significant correlations between T-cell SIs and age, sex, BMIz, or WC (after adjustment of WC for age and sex) in this control group. These data for age-matched FDRs with low HLA risk are similar to those previously reported in unrelated controls (8,30,31).
Islet Autoantibody Distribution
Islet cell autoantibodies were detected in 232 (89%) diabetic patients using the conventional autoantibody assays (GAD, IA-2, ICA, and IAA). Autoantibody distribution was similar to our previous cohorts (11,17): 15% (n = 40) with one positive, 31% (n = 81) with two positive, and 43% (n = 111) with three or four positive autoantibodies. The percent of individuals positive for each autoantibody was as follows: 52% GAD, 71% IA-2, 66% IAA, and 80% ICA. Positive autoantibodies were seen in 88% of patients with positive T-cell reactivities, as well as all but 1 of 21 patients with negative T-cell responses. Of the 195 ICA-positive patients, 155 (79%) were also positive for ICA-R. An additional 37 of 66 (56%) who were ICA negative were ICA-R positive. ICA-R was positive in only one control FDR.
Relationships of B- and T-Cell Autoimmunity With Adiposity in Diabetic Patients
BMIz (but not age- and sex-adjusted WC) was highest in autoantibody-negative group (1.4 [0.5–2.5]) compared with those with one or more islet autoantibodies (BMIz range 0.5–0.9) (P = 0.03). Neither parameter (BMIz nor WC) affected the diversity of the fully expanded T-cell autoreactivities to the 10 type 1 diabetes–associated test analytes (Table 2). This diversity was also unrelated to the presence or absence of four different type 1 diabetes–associated autoantibodies. Comparisons of measures of adiposity with numbers of positive T-cell reactivities grouped as negative, moderate, or strong positive revealed no differences in BMIz, WC adjusted for age and sex, or number of positive autoantibodies (Table 2). There were no significant correlations between numbers of T-cell reactivities and measures of adiposity nor was there a relationship between antibody type and measures of adiposity.
There were significant positive correlations between T-cell SI and BMIz for each of the five neuronal antigens (EX2, r = 0.14, P = 0.03; MBP, r = 0.14, P = 0.03; GFAP, r = 0.14, P = 0.03; s100, r = 0.03, P = 0.03; and Tep69, r = 0.18, P = 0.006); the latter is an epitope of both a neuronal and islet secretory antigen. When BMI was divided according to World Health Organization percentiles (<25th, 25th to 85th, and >85th) in order to assess the relationships with conventional assessment of obesity, significantly higher SIs were found in the BMI >85th percentile subjects for EX2, MBP, GFAP, and s100 (P < 0.05), but the distribution of subjects was unequal (<25th percentile n = 7, 25th to 85th n = 137, and >85th n = 117) (Supplementary Fig. 2). Therefore, subjects were divided into BMIz quintiles in order to compare the leanest with the most obese groups (n = 52 per quintile, 53 in highest quintile). Similar results were obtained with the most obese quintile showing the highest T-cell SI to three neuronal antigens (EX2, MBP, and GFAP) (P = 0.03, 0.04, and 0.02, respectively) (Fig. 1A), with a trend toward higher SIs for all other test analytes.

A: T-cell SI in response to each analyte by highest and lowest BMIz quintile. Black bar, lowest quintile; white bar, top quintile (BMIz). Left axis, diabetes-related analytes; right axis, positive control analytes (note different scales). *P < 0.05. B: T-cell SI comparing waist <25th percentile and >85th percentile. Black bar, <25th percentile; white bar, >85th percentile. Left axis, diabetes-related analytes; right axis, positive control analytes (note different scales). *P < 0.05; **P < 0.01; #P < 0.001.
A: T-cell SI in response to each analyte by highest and lowest BMIz quintile. Black bar, lowest quintile; white bar, top quintile (BMIz). Left axis, diabetes-related analytes; right axis, positive control analytes (note different scales). *P < 0.05. B: T-cell SI comparing waist <25th percentile and >85th percentile. Black bar, <25th percentile; white bar, >85th percentile. Left axis, diabetes-related analytes; right axis, positive control analytes (note different scales). *P < 0.05; **P < 0.01; #P < 0.001.
Similar results were obtained when comparing T-cell SIs according to WC percentile, comparing the highest WC to the lowest (<25th n = 55 and >85th n = 45) and controlling for BMIz because BMIz was higher in the highest WC group (<25th 0.24 ± 6.7 and >85th 1.95 ± 0.61) (P < 0.001). Those with the highest WC percentile demonstrated significantly higher T-cell SIs for all five neuronal antigens (EX2, MBP, GFAP, s100, and Tep69) (P = 0.01, 0.01, <0.001, 0.002, and 0.03, respectively) as well as two islet antigens (GAD and PI) (P = 0.01 and 0.02, respectively) and a trend toward higher SIs for all other islet antigens (Fig. 1B). These relationships between T-cell SI and BMIz and waist were not present in positive control analytes (Fig. 1A and B).
There were no correlations between T-cell SI and age, sex, race, C-peptide levels, or HbA1c at onset or 3 months. Age, race, sex, and HbA1c were similar across the BMIz and WC percentile groups and were not considered contributing factors to the significant differences observed.
Relationships of Autoimmunity to Adiposity and C-Peptide
Patients were divided into four subgroups based on the following characteristics: autoantibody positive and T-cell positive (Ab+/T+), autoantibody positive and T-cell negative (Ab+/T−), autoantibody negative and T-cell positive (Ab−/T+), and autoantibody negative and T-cell negative (Ab−/T−). The Ab−/T− group with only one subject was not analyzed. There were no differences in C-peptide levels (Fig. 2) or HbA1c at either onset or 3 months. Adjustments for age and BMIz were required because the Ab+/T+ group was younger than the other groups (mean ages 9.6, 11.4, and 11.4 years, respectively; P = 0.007). BMIz was highest in the Ab−/T+ group and statistically significant by 2–3 months (Fig. 2).
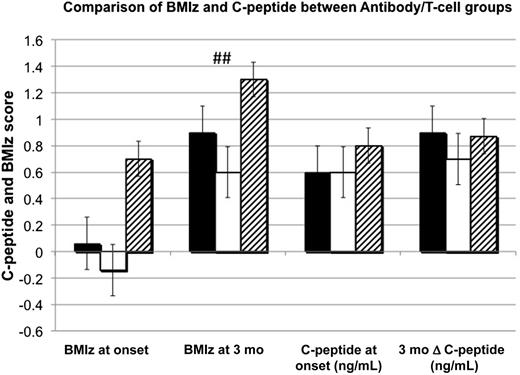
Comparison of BMIz and C-peptide between antibody/T-cell groups. Black bar, Ab+/T+ = antibody positive, T-cell positive; white bar, Ab+/T− = antibody positive, T-cell negative; hatched bar, Ab−/T+ = antibody negative, T-cell positive. ##P = 0.006, results expressed in means for BMIz and medians for C-peptide.
Comparison of BMIz and C-peptide between antibody/T-cell groups. Black bar, Ab+/T+ = antibody positive, T-cell positive; white bar, Ab+/T− = antibody positive, T-cell negative; hatched bar, Ab−/T+ = antibody negative, T-cell positive. ##P = 0.006, results expressed in means for BMIz and medians for C-peptide.
We also investigated the relationship between onset C-peptide levels and T-cell SI and number of positive T-cell autoreactivities using multiple linear regression analysis, controlling for BMIz, age, and HbA1c, which each contributed significantly to C-peptide (P < 0.001 for all). There were no relationships between C-peptide and T-cell reactivity amplitudes nor number of positive reactivities to T-cell analytes (P = 0.11).
Relationships Between B- and T-Cell Autoimmunity
The median number of positive T-cell responses was 10 (9–10), regardless of number of positive autoantibodies. Because most patients had positive T-cell reactivities to the majority of analytes, there were no correlations between numbers of positive B- and T-cell autoreactivities. When number of T-cell reactivities were grouped into negative (<4), positive (4–8), or strongly positive (9–10) responses, there were no differences between the groups, all with a median of two positive islet autoantibodies (Table 2). There were also no relationships between the number of positive autoantibodies and the SI for any of the 10 test analytes. Of the 29 patients who were autoantibody negative, all but 1 had positive T-cell responses, with the number of responses ranging from 8 to 10. Evaluation of relationships between positivity to each type of autoantibody and the T-cell reactivities to the corresponding antigen demonstrated concordance in the majority of subjects (Gad+/GAD+ 88%, Tep69+/ICA69+ 90%, and PI+/IAA+ 93%).
Evaluation of Autoantibody-Negative Patients
Twenty-nine subjects were negative for conventionally assessed islet autoantibodies. Of the 28 patients without standard islet autoantibodies, but with positive T cells, 11 (39%) had positive ICA-R as did the 1 subject with negative T-cell responses and conventional autoantibodies, including ZnT8 autoantibodies. This Ab−/T− child was an obese Hispanic 2 year old with ketosis at onset and autoimmune hypothyroidism, with the low-risk HLA Asp57/Asp57 haplotype and no clinical evidence of MODY (maturity-onset diabetes of the young).
ZnT8 was measured in these autoantibody-negative subjects. Two of 29 subjects (7%) were positive for ZnT8. Therefore, with addition of ZnT8, 27 of 261 subjects (10%) were autoantibody negative. The reclassification of these subjects as autoantibody positive did not change any of the above findings.
HLA Status and Islet Autoreactivity
Patients were classified according to diabetes risk HLA DQ: 19% DQ2/DQ8, 5% DQ8/8, 6% DQ2/2, 51% either DQ2 or DQ8, and 19% neither DQ2 nor DQ8 (Table 1). There were no relationships between number, SI, or type of T-cell reactivities with HLA DQ2, 8, or 2/8 genotypes or those with Asp57/Asp57, non-Asp57/Asp57, or non-Asp57/non-Asp57. The protective HLA DQ 0602 was present in four patients, all of whom had positive (9–10) T-cell responses and two had positive islet autoantibodies. The lowest-risk DQ Asp57/Asp57 alleles were present in 8 of 261 diabetic patients (3%), of whom 5 were autoantibody positive and by definition type 1. The other three Asp57/Asp57 patients with negative autoantibodies were obese; two had positive T-cell responses and the other had thyroid autoimmunity and positive ICA-R.
Conclusions
All but one patient with clinical type 1 diabetes had either T- or B-cell diabetes–associated autoimmunity, regardless of clinical phenotype, and quite different from a control group of FDRs with low-risk HLA (Asp57/Asp57) haplotypes. Our investigation of relationships between adiposity and islet cell autoimmunity in this cohort, with a high prevalence of overweight and obesity, demonstrates significantly higher T-cell amplitudes, especially to neuronal antigens, in those with the greatest adiposity. The relationships between high WC, a surrogate marker for insulin resistance in children (25), and the amplification of reactivities to diabetes-related antigens suggests a possible mechanistic role for insulin resistance.
The mechanistic basis for the preference of recruiting autoreactivity to neuronal antigens remains unclear. The importance of neuronal elements in type 1 diabetes development has been previously identified by our group, in mice, and extended in recent ongoing studies to patients (24). This finding of amplified T-cell reactivities in the most obese patients is in keeping with the recent understanding of obesity-related inflammation (33), with adiposity creating a highly proinflammatory milieu (21). This environment enhances T-cell autoreactivity in overweight/obese hosts, including new-onset insulin-requiring diabetic patients, with recruitment and local expansion of the fat-resident, highly activated, and T-cell receptor–selected immunome and its secretory proinflammatory signals (13,34,35). Although originally considered a local adipose tissue process, a wide array of systemic cytokines are found in metabolic syndrome patients (36), including children (37).
The finding of diverse T-cell autoimmunity as well as zinc transporter autoantibodies and nonclassical islet antibodies using cafeteria (over-) fed rat pancreas as substrate provide evidence that type 1 diabetes autoimmunity targets a range of antigens and epitopes beyond those assessed by standard measurements of autoantibodies to GAD, IA-2, insulin, and classical ICA. Studies of T-cell autoreactivities in obese adults with metabolic syndrome or clinically diagnosed type 2 diabetes (21,22) as well as B6 mice with diet-induced obesity (13) typically demonstrate responses against wide arrays of self-proteins with impressive differences between insulin-resistant and -sensitive patients, strengthening the strong evidence for a link between the cognate (TCR-selecting) autoimmunity and progressive metabolic dysfunction.
Obese patients with higher-risk HLA genotypes and positive islet antibodies are typically defined as having type 1 diabetes, despite their insulin-resistant phenotype (38). We have demonstrated here that a subset of patients who may have been classified as having type 2 diabetes, due absence of conventional autoantibodies, did in fact have broad diabetes-related T-cell autoimmunity. This clinical scenario has been previously described in adults and children with clinical type 2 diabetes, using a different T-cell assay technique (9,10). Our observation leads to the suggestion that all insulin-deficient pediatric diabetes is an inflammatory process with a spectrum of clinical and autoimmune presentation. Validation studies of this T-cell proliferative assay have confirmed its robustness in differentiating type 1 diabetic patients from control subjects (8,39). We propose that the link between obesity/insulin resistance and autoimmunity is presentation earlier in the course of autoimmune progression with insulin concentrations inadequate to maintain euglycemia in an insulin-resistant patient at a point in development of diabetes where euglycemia would be maintained in an insulin-sensitive individual. Therefore, we see patients presenting with diabetes at a point in the autoimmune damage where only T cells (and not yet autoantibodies) are measurable. The inflammation of obesity may be providing an additional stress on the β-cell, resulting in more rapid damage. These hypotheses will be further investigated in an initiated prospective follow-up of new-onset patients, and in our current study of T-cell responses prior to development of diabetes in FDRs prior to the development of autoimmunity and/or diabetes. This cross-sectional study cannot address rates of development of B- or T-cell autoimmunity. There is one implication of this conclusion that eventually may alter therapeutic strategy. If future investigation demonstrates that an obesity-driven general inflammation facilitates the survival and the proliferation of autoreactive, diabetogenic T and B cells, a novel therapeutic approach could be to first suppress, in a general manner, TH1-driving processes in the inflammation, potentially deviating them toward a TH2 state. The consequence of this would be that the autoreactive T and B cells would be suppressed or suspended in their abilities to drive autoimmunity. Once this state is achieved, antigen-specific strategies could be used to eradicate the autoreactive T and B cells.
In summary, our data confirm a diabetes-related autoimmune milieu in children with insulin-requiring diabetes, irrespective of obesity or the presence or absence of conventional islet autoantibodies. Our observations link obesity and diabetes-related autoimmunity with amplification of T-cell responses, especially to type 1 diabetes–related neuronal antigens in those individuals with the greatest adiposity and/or insulin resistance. This association suggests the possibility of obesity-related inflammation driving the autoimmune process.
Article Information
Acknowledgments. The authors express their gratitude to laboratory technicians David Groscost (University of Pittsburgh), Katie McDowell (University of Pittsburgh), and Susan Pietropaolo (University of Michigan); study coordinator Maribel Cedillo (University of Pittsburgh); Dr. Liping Yu (Barbara Davis Center for Diabetes, Denver, CO) for the zinc transporter autoantibody assay; and all the diabetes research nurses, study participants, and their parents.
Funding. This work was supported by Canadian Institutes of Health Research grant 231461 (H.-M.D.), National Institutes of Health (NIH) grants UL1-RR-024153 and UL1-TR-000005 (The Pediatric Clinical and Translational Research Center) and the Renziehausen Fund (I.L.), and NIH grants R01-DK-053456 (M.P.) and R01-DK-024021 (D.J.B.).
Duality of Interest. No potential conflicts of interest relevant to this article were reported.
Author Contributions. M.A.B. is a military service member. This work was prepared as part of her official duties. Title 17, USC, §105 provides that “Copyright protection under this title is not available for any work of the U.S. Government.” Title 17, USC, §101 defines a U.S. Government work as a work prepared by a military service member or employee of the U.S. Government as part of that person's official duties.
M.A.B. compiled and analyzed the data and wrote the manuscript. H.-M.D. created the T-cell methodology, contributed to the concept of the study, and reviewed and edited the manuscript. I.L. contributed to the concept and design, researched data, and edited the manuscript. V.C.A. and Y.H. managed the database, assisted with statistical analysis, and reviewed and edited the manuscript. R.K.C. assayed all T-cell samples and reviewed the manuscript. M.T. assayed and interpreted HLA data. M.P. provided GAD and IA-2 data, contributed to the concept and design, contributed to the discussion, and reviewed and edited the manuscript. D.J.B. contributed to the concept and design, researched data, provided IAA and ICA data, contributed to the discussion, and reviewed and edited the manuscript. D.J.B. is the guarantor of this work and, as such, had full access to all the data in the study and takes responsibility for the integrity of the data and the accuracy of the data analysis.
Prior Presentation. This work was presented in abstract form at the Pediatric Academic Societies/Pediatric Endocrine Society Annual Meeting, Washington DC, 4–7 May 2013; the 73rd Scientific Sessions of the American Diabetes Association, Chicago, IL, 21–25 June 2013; the 39th International Society for Pediatric and Adolescent Diabetes Annual Conference, Gothenburg, Sweden, 16–19 October 2013; and the 13th International Congress of the Immunology of Diabetes Society, Melbourne, Australia, 7–11 December 2013.