


We characterized and correlated endothelial progenitor cells (EPCs) and circulating progenitor cells (CPCs) with lack of vascular complications in the Joslin Medalist Study in patients with type 1 diabetes for 50 years or longer.
EPC and CPC levels were ascertained by flow cytometry and compared among Medalists (n = 172) with or without diabetic retinopathy (DR; n = 84 of 162), neuropathy (n = 94 of 165), diabetic nephropathy (DN; n = 18 of 172), cardiovascular disease (CVD; n = 63 of 168), age-matched controls (n = 83), type 2 diabetic patients (n = 36), and younger type 1 diabetic patients (n = 31). Mitogens, inflammatory cytokines, and oxidative markers were measured in blood or urine. Migration of cultured peripheral blood mononuclear cells (PBMCs) from Medalists and age-matched controls were compared.
Medalists’ EPC and CPC levels equaled those of their nondiabetic age-matched controls, were 10% higher than those in younger type 1 diabetic patients, and were 20% higher than those in age-matched type 2 diabetic patients. CPC levels were 15% higher in Medalists without CVD and nephropathy than in those affected, whereas EPC levels were significantly higher in those without peripheral vascular disease (PVD) than those with PVD. Stromal-derived factor 1 (SDF-1) levels were higher in Medalists with CVD, DN, and DR than in those not affected and their controls. IGF-I levels were lower in Medalists and correlated inversely with CPC levels. Additionally, cultured PBMCs from Medalists migrated more than those from nondiabetic controls.
Normal levels of EPC and CPC in the Medalists, unlike other groups with diabetes, especially those without CVD, support the idea that endogenous factors exist to neutralize the adverse effects of metabolic abnormalities of diabetes on vascular tissues.
Introduction
Diabetes may impair the process of recruitment and differentiation of adult pluripotent cells to sites of injury (1–4). Circulating progenitor cells (CPCs) and endothelial progenitor cells (EPCs) are hypothesized to participate and be markers of endothelium repair after vascular injury. A consistent association of reduced levels of circulating EPC with prevalence and incidence of cardiovascular complications has been reported in diabetic and nondiabetic populations (5–8). Furthermore, duration of diabetes and poor glycemic control are significantly associated with decreased levels of EPC (4,7,9). Besides a reduction in numbers, diabetes may impair the function of EPCs to enhance the integrity of the endothelium (4). These abnormal functions of EPCs may potentially be markers for the development of diabetic vascular complications (9–12).
Multiple sources of CPCs and EPCs include bone marrow, liver, and intestinal cells (13,14). EPCs express markers for stem cells, including CD34, CD133, and the endothelial cell marker vascular endothelial growth factor receptor 2 (VEGFR2) (15,16), whereas CPCs only have markers for stem cells. Cultured with selected cytokines and growth factors, both CPCs and EPCs may exhibit endothelial cell markers and functions (16). The ability of EPCs to incorporate into injured endothelium has not been consistently demonstrated, with the percentage reported from 0 to 50% (1,13,17–20). Despite the lack of consensus on the mechanism of their actions, increased EPC levels have been associated with reduction of cardiovascular risk factors (5). One postulated mechanism of EPC and CPC action is their possible contribution to induction of proangiogenic cytokines (21).
Vascular endothelial growth factor (VEGF) and stromal-derived factor 1 (SDF-1) are secreted cytokines that can stimulate EPC mobilization from the bone marrow into injured tissues (22,23). SDF-1 may be increased in the vitreous of patients with proliferative diabetic retinopathy (PDR), possibly contributing to the neovascularization process (24). Elevated levels of SDF-1 have been reported in mouse models of diabetic nephropathy (DN) (25). Common risk factors associated with decreased EPCs and diabetes as well as its complications include glycemic control, duration of disease, increased oxidative stress, and inflammatory levels (26). Thus we hypothesized that EPC or CPC levels, with possible correlations to SDF-1 and VEGF, could be involved in protecting diabetic patients against complications development. Therefore, we examined a cohort of type 1 diabetic patients with extreme disease duration (27,28). The Joslin Medalist Study has characterized over 600 individuals who have had type 1 diabetes for 50 years or longer. Clinical and biochemical analyses have shown that ∼35% exhibited no mild microvascular complications, including PDR, DN, and neuropathy without association with HbA1c (29). Our goal was to determine whether CPC or EPC levels could be markers for protection against microvascular complications in this unique cohort compared with age-matched subjects and nondiabetic controls as well as young type 1 and type 2 diabetic subjects.
Research Design and Methods
Study Subjects
Details of the Medalist Study have been described extensively elsewhere (27–29). In brief, 50-year Medalists have documented 50 or more years of insulin dependence and been awarded the Joslin Diabetes Center 50-Year Medal.
Five groups were enrolled. A subset of 172 Medalists was selected by consecutive participation in the study between April 2010 and September 2011 (21–23). The inclusion criterion for subjects with type 1 diabetes of less than 50 years was insulin dependence within 6 months of diagnosis (n = 31). Inclusion criteria for subjects with type 2 diabetes were diagnosis after the age of 18 years, noninsulin dependent diabetes, and diabetes managed with oral hypoglycemic agents for over 1 year (n = 36). The diagnosis of diabetes was established by HbA1c ≥6.5% and/or fasting glucose >125 mg/dL in two measurements as described by the American Diabetes Association guidelines (n = 36) (30). Age-matched controls (older controls n = 50 and younger controls n = 31) had an HbA1c of less than 6% without insulin or hypoglycemic treatment, and mean ages were 65.8 ± 7.7 years and 35.9 ± 12 years, respectively. Non-Medalists and age-matched controls were recruited through advertisements in the Beetham Eye Institute at the Joslin Diabetes Center and craigslist.
Informed consent was obtained from all subjects prior to participation in the study. Individuals traveled to the Joslin Diabetes Center for physical and ophthalmic examinations and biospecimen collections of urine and blood. Participants completed questionnaires regarding medical history, lifestyle, diet, and physical activity. Physical activity was based on self-reported data from a modified Pfaffenberger college alumni questionnaire that included sports, recreational, household, and job-related activities (31). The Joslin Committee on Human Studies approved the study protocol and informed consent forms.
Procedures
Participants fasted for 8 h before blood draw. Peripheral neuropathy was assessed using the Michigan Neuropathy Screening Index (MNSI) (32). Patients had a dilated fundoscopic examination by an ophthalmologist with seven standard field stereoscopic fundus photographs graded for clinical severity of diabetic retinopathy (DR) according to the Early Treatment Diabetic Retinopathy Study protocol. Cardiovascular history was defined as self-reported history of coronary artery bypass surgery, angioplasty, coronary stent placement, myocardial infarction, or angina. Peripheral vascular disease (PVD) was described as reported history of PVD, lower limb angioplasty, or shunt/graft surgery. Nephropathy was defined as an estimated glomerular filtration rate (eGFR) of <45 mL/min per 1.73 m2, following the criteria used by Levey et al. (33). An albumin-to-creatinine ratio (ACR) of ≤30 mg/mmol was used as evidence for lack of DN.
Assays
Quantification of CPCs and EPCs
Whole blood samples from patients were processed within 2 h of collection. Samples were assessed by flow cytometry on an LSR II (BD Biosciences, San Jose, CA) using the following antibodies: Allophycocyanin-conjugated CD133 (Miltenyi Biotec, Auburn, CA), PerCP-conjugated CD34 (BD Biosciences), and PE-conjugated VEGFR2 (R&D Systems, Emeryville, CA). Data were analyzed with FlowJo software (Tree Star, Ashland, OR). Patient samples were performed in triplicate; the mean of three runs was used as CPC and EPC levels. To assess interassay variability, five samples from one patient were drawn on five separate days and analyzed with consistent results (<5% variation). CPCs were quantified as cells positive for CD34 and CD133 markers. EPCs were quantified as cells positive for CD34, CD133, and VEGFR2 markers.
Isolation and Culturing of Peripheral Blood Mononuclear Cells
Samples of venous blood (16 mL) were centrifuged and segregated by Ficoll density gradient, and 5 × 10⁶ cells per well were cultured in M199 medium with 20% FBS on gelatin-coated plates. All assays were performed in cells after passage 1 and were enriched for CD34 and CD133 markers to 20% of cells tested, an enrichment of fourfold to fivefold.
Migration Assay
Migration was measured using a Matrigel invasion chamber (BD Biosciences). Briefly, 2 × 10⁴ cultured peripheral blood mononuclear cells (PBMCs) per Transwell were seeded in serum-free growth medium. VEGF-A165 (50 ng/mL; R&D Systems) was added to serum-free media in the lower chamber and incubated for 16 h. The nuclei were stained with DAPI, and the average number of four fields at 20× magnification was taken using an Olympus AX70 microscope.
Biochemical Analysis
HbA1c was determined by high-performance liquid chromatography (Tosoh G7 and 2.2). C-reactive protein (CRP) was measured by particle-enhanced immunonephelometry (BN ProSpec analyzer, Dade Behring, Deerfield, IL). Lipid profiles were determined by standard methods (kits from Roche Diagnostics; Denka Seiken, Japan; and Asahi Kasei, Japan). Plasma levels of plasminogen activator inhibitor 1 (PAI-1; R&D Systems), soluble vascular cell adhesion molecule 1 (sVCAM-1; Invitrogen, Grand Island, NY), adiponectin (Millipore, Billerica, MA), IGF-I (R&D Systems), urine isoprostane (Oxis Research, Foster City, CA), and SDF-1 (R&D Systems) were measured by ELISA.
RNA Extraction and Microarray Analysis
Total RNA was extracted from PBMCs after the first passage using the RNAeasy kit (Qiagen, Valencia, CA). RNA (1 μg) from each cell sample was hybridized to an Affymetrix U133 2.0 probe array cartridge (Affymetrix, Santa Clara, CA). PBMCs from five Medalists without history of cardiovascular disease (CVD) and seven from Medalists with CVD were studied.
Statistical Analysis
Results are expressed as mean ± SD. Descriptive statistics were examined to determine distribution, and when necessary, variables were log transformed. Kruskal–Wallis and χ2 tests for homogeneity were used for two-way comparisons. ANOVA and regression analyses were used for between-group comparisons. Logistic regression was used to determine the relationship of complications with CPC and EPC levels, adjusting for covariates, and to test for effect modification. A bivariate association of P = 0.1 was used for testing a covariate for entry into the multivariate model. A 15% change in β was used to test for confounding. Analyses were done using Intercooled STATA/SE version 12.0 (StataCorp, College Station, TX). A level of P < 0.05 was used to indicate statistical significance.
Results
Characteristics of Study Subjects
The mean age of the subset of Medalists was 66.3 ± 7.3 years (n = 172), with 45.9% male (n = 79). Their mean HbA1c was 7.2 ± 0.9%, age at diagnosis 10.0 ± 6.7 years, and duration of diabetes 56.4 ± 6.6 years. The mean daily insulin dose was 0.44 ± 0.19 units/kg. Total serum levels of cholesterol were 154.2 ± 31.4 mg/dL, HDL 62.7 ± 18.3 mg/dL, and LDL 77.5 ± 23.1 mg/dL. Serum triglyceride levels were 70.2 ± 31.4 mg/dL. Mean systolic and diastolic blood pressures were 133.2 ± 14.7 and 66.5 ± 8.6 mmHg, respectively. Among the Medalists, 43.6% (n = 75) were diagnosed with PDR, 23.4% (n = 36) had an ACR >30 mg/mmol, 10.5% (n = 18) had an eGFR <45 mL/min per 1.73 m2, and 57.0% (n = 94) were diagnosed with neuropathy (MNSI >2). Self-reported CVD by survey was present in 37.5% (n = 63) (Table 1). Medication history showed 69% of Medalists were on antihypertensives and 69% were taking lipid-lowering medications. Among the Medalists, 44% (n = 75) reported ever smoking. All of these clinical characterizations are comparable to the whole cohort of the Medalists Study reported previously (29).
Characteristics of patients: controls, Medalists, type 2 diabetes, younger controls, and type 1 diabetes
| Medalists | Controls | Type 2 diabetes | Type 1 diabetes | Younger controls | |
|---|---|---|---|---|---|
| Age, years | 66.3 ± 7.3 (172) | 65.8 ± 7.7 (50) | 63.3 ± 7.3(36) | 35.9 ± 12.0 (31)* | 32.6 ± 8.9 (33)* |
| Sex, % male | 45.9 (79/172) | 50.0 (25/50) | 61.1 (22/36) | 41.9 (13/31) | 51.5 (17/33) |
| HbA1c, % | 7.2 ± 0.9 (172) | 5.8 ± 0.3 (45) | 7.7 ± 1.3 (36)* | 8.2 ± 1.5 (31)* | 5.5 ± 0.3 (33)* |
| HbA1c, mmol/mol | 55 ± 10 (172) | 40 ± 3 (45) | 61 ± 15 (36)* | 66 ± 17 (31)* | 37 ± 4 (33)* |
| Age at diagnosis, years | 10.0 ± 6.7 (172) | — | 54.8 ± 8.5 (36) | 19.1 ± 12.3 (31) | — |
| Duration of diabetes, years | 56.4 ± 6.6 (172) | — | 8.9 ± 6.7 (33) | 18.7 ± 12.3 (31) | — |
| Insulin, units/kg | 0.44 ± 0.19 (168) | — | 0.23 ± 0.14 (2) | 0.48 ± 0.19 (31) | — |
| BMI | 26.4 ± 4.5 (172) | 27.5 ± 4.6 (49) | 33.1 ± 8.5 (36)* | 25.8 ± 5.0 (31) | 26.2 ± 5.3 (33) |
| Systolic blood pressure, mmHg | 133.2 ± 14.65 (168) | 127.1 ± 11.5 (47) | 129.9 ± 14.8 (36) | 118.5 ± 14.7 (31)* | 115.8 ± 11.3 (33)* |
| Diastolic blood pressure, mmHg | 66.5 ± 8.6 (168) | 72.8 ± 8.9 (47) | 72.17 ± 10.11 (36)* | 70.4 ± 7.66 (31) | 69.03 ± 8.56 (33) |
| LDL, mg/dL | 77.5 ± 23.1 (171) | 102.7 ± 28.2 (49) | 86.4 ± 28.3 (36)* | 102.1 ± 32.3 (31) | 101.9 ± 26.4 (33) |
| HDL, mg/dL | 62.7 ± 18.3 (172) | 58.45 ± 13.5 (49) | 46.9 ± 13.7 (36)* | 63.6 ± 20.8 (31) | 61.3 ± 19.5 (33) |
| Triglycerides, mg/dL | 70.2 ± 31.4 (172) | 98.6 ± 38.0 (49) | 186.7 ± 124.0 (36)* | 86.4 ± 38.8 (31) | 86.4 ± 38.8 (33) |
| Total cholesterol, mg/dL | 154.2 ± 31.4 (172) | 179.7 ± 36.6 (49) | 170.5 ± 35.3 (36) | 184.7 ± 39.7 (31) | 180.6 ± 32.7 (33) |
| Retinopathy, PDR | 51.9 (84/162) | — | 12.5 (4/32) | 3.5 (1/29) | — |
| Nephropathy, ACR >30 | 23.4 (36/154) | 10.6 (5/47) | 30.6 (11/36) | 10.0 (3/31) | 3.0 (1/33)* |
| Nephropathy, eGFR <45 | 10.5 (18/172) | 5.6 (2/36) | 0.0 (0/17) | — | 0.0 (0/31) |
| Neuropathy, MNSI >2 | 57.0 (94/165) | — | 74.1 (20/27) | 20.0 (6/30) | 3.0 (1/33) |
| CVD* | 37.5 (63/168) | 9.3 (4/43) | 25.0 (9/36)* | 0.0 (0/33)* | 0.0 (0/33)* |
| Oral glucose-lowering drugs | — | — | 77.4 (24/31) | — | — |
| Blood pressure drugs | 69.0 (116/168) | 32.5 (14/43) | 70.6 (24/34)* | 23.6 (9/29) | 3.0 (1/33) |
| Lipid-lowering drugs | 69.0 (116/168) | 40.4 (19/47) | 57.6 (19/33) | 21.4 (6/28)* | 0.0 (0/27)* |
| Smoking history | 43.6 (75/171) | 34.7 (17/49) | 61.1 (22/36)* | 50.0 (14/28)* | 39.4 (13/33) |
Data are mean ± SD (n) or percentage of population followed by frequency (n/N). Boldface data represent difference from Medalists (P < 0.05).
*Difference from controls. P value reflects Kruskal–Wallis.
For age-matched controls, the mean age was 65.8 ± 7.7 years, with 50% (n = 25 of 50) male. Total serum cholesterol levels were 179.7 ± 36.6 mg/dL, HDL 58.4 ± 13.5 mg/dL, and LDL 102.7 ± 28.2 mg/dL (Table 1). Serum triglyceride levels were 98.6 ± 38 mg/dL. Mean systolic and diastolic blood pressures were 127.1 ± 11.5 and 72.8 ± 8.9 mmHg, respectively. The renal function of the controls showed 10.6% (n = 5) with an ACR >30 mg/mmol, 5.5% (n = 2) with an eGFR <45 mL/min per 1.73 m2, and 9.3% (n = 4) with self-reported CVD. Among the controls for the Medalists with a comparable age of 65.8 ± 7.7 years (n = 5), 32.5% and 40.4% reported being on antihypertensives and lipid-lowering medications, respectively, and 34.7% (n = 17) reported ever smoking (Table 1).
The clinical characteristics of other comparison groups—1) patients with type 2 diabetes, 2) younger patients with type 1 diabetes, and 3) younger controls in whom CPCs and EPCs were measured—are presented in Table 1. Younger patients with type 1 diabetes had a mean age of 35.9 ± 12 years (n = 31) and duration of disease of 18.7 ± 12.3 years, and 42% were male (n = 13). The type 2 diabetes group was of comparable age as the Medalists (63.3 ± 7.3 years), mean age at diagnoses was 54.8 ± 8.5 years, and duration of disease was 8.9 ± 6.7 years (Table 1).
EPC and CPC Levels Across Groups
Despite the Medalists’ extreme duration of diabetes, EPC and CPC levels were comparable with those of age-matched controls (EPCs, 137 ± 49 vs. 129 ± 44 per 106 cells; CPCs, 377 ± 117 vs. 368 ± 124 per 106 cells; P = not significant) (Fig. 1A and B). Compared with those with type 2 diabetes, Medalists had more EPCs and CPCs (EPCs, 137 ± 49 vs. 114 ± 47 per 106 cells, P = 0.03; CPCs, 377 ± 117 vs. 301 ± 124 per 106 cells, P < 0.001, respectively) (Fig. 1A and B). Medalists’ CPC levels were also higher than those in younger patients with type 1 diabetes (377 ± 118 vs. 329 ± 91 per 106 cells; P = 0.035) (Fig. 1B). In contrast, EPC and CPC levels were lower in younger patients with type 1 diabetes than in younger controls (EPCs, 166 ± 57 vs. 125 ± 50 per 106 cells, P < 0.005; CPCs, 432 ± 91 vs. 329 ± 91 per 106 cells, P = 0.01) (Fig. 1A and B, respectively) as expected. CPCs in the type 2 diabetic patients were also decreased compared with their age-matched controls (368 ± 124 vs. 301 ± 124 per 106 cells; P = 0.015) (Fig. 1B). These data show that Medalists have the highest EPC and CPC numbers of all groups with diabetes despite having the longest exposure to the disease.
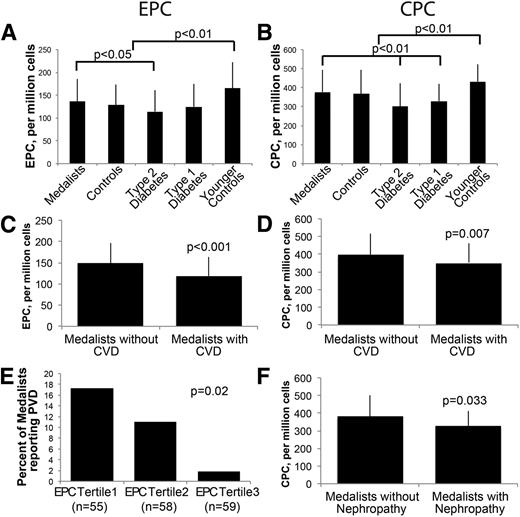
EPC and CPC levels are high in Medalists, and their levels are higher in Medalists without CVD or nephropathy. Flow cytometry of (A) EPCs or (B) CPCs in Medalists, controls, type 2 diabetic subjects, type 1 diabetic subjects, and younger controls. (C) EPCs and (D) CPCs are higher in Medalists without CVD than in Medalists with CVD. E: Medalists were divided into tertiles according to their EPC levels. EPCs were lower in Medalists who reported PVD. F: CPCs in Medalists without evidence of nephropathy versus Medalists with nephropathy. Younger controls, n = 33; type 1 diabetic subjects, n = 36; controls, n = 50; type 2 diabetic subjects, n = 36; Medalists, n = 172; Medalists with CVD, n = 63 of 168; Medalists with nephropathy, n = 18 of 172. Graphs show mean, SD. Significance represents Fisher χ2 (E) or Kruskal–Wallis test, P < 0.05.
EPC and CPC levels are high in Medalists, and their levels are higher in Medalists without CVD or nephropathy. Flow cytometry of (A) EPCs or (B) CPCs in Medalists, controls, type 2 diabetic subjects, type 1 diabetic subjects, and younger controls. (C) EPCs and (D) CPCs are higher in Medalists without CVD than in Medalists with CVD. E: Medalists were divided into tertiles according to their EPC levels. EPCs were lower in Medalists who reported PVD. F: CPCs in Medalists without evidence of nephropathy versus Medalists with nephropathy. Younger controls, n = 33; type 1 diabetic subjects, n = 36; controls, n = 50; type 2 diabetic subjects, n = 36; Medalists, n = 172; Medalists with CVD, n = 63 of 168; Medalists with nephropathy, n = 18 of 172. Graphs show mean, SD. Significance represents Fisher χ2 (E) or Kruskal–Wallis test, P < 0.05.
Effects of CVD and Nephropathy on EPC and CPC Levels in Medalists
EPC and CPC levels were higher in Medalists without CVD compared with those with CVD (EPCs, 148 ± 49 vs. 119 ± 44 per 106 cells, P < 0.001; CPCs, 398 ± 118 vs. 348 ± 109 per 106 cells, P < 0.007) (Fig. 1C and D). Prevalence of PVD decreased significantly with increased EPC levels by tertile (Fig. 1E; P = 0.02). Medalists without nephropathy had higher levels of CPC than Medalists with nephropathy (382 ± 119 vs. 328 ± 83 per 106 cells; P = 0.03), but EPC levels did not differ significantly (138 ± 51 vs. 128 ± 26; P = not significant). No association was found between EPCs or CPCs and PDR (EPCs, 129 ± 44 vs. 134 ± 55 per 106 cells; CPCs, 354 ± 114 vs. 364 ± 124 per 106 cells) or neuropathy status (EPCs, 142 ± 51 vs. 131 ± 50 per 106 cells; CPCs, 367 ± 124 vs. 368 ± 121 per 106 cells). Within the Medalists, EPC and CPC levels correlated with HDL, total cholesterol, diastolic blood pressure, and age (Supplementary Table 1). EPC levels also correlated inversely with taking lipid-lowering agents. Medalists with the highest EPC levels have the least prevalence of lipid-lowering drugs (P < 0.03). The extent of exercise was also correlated with EPC levels, which positively correlated with increasing amounts of exercise (P < 0.07) (Supplementary Fig. 2). Finally, within the Medalist group, history of CVD correlated weakly with neuropathy (P = 0.01) and showed a trend with nephropathy (P = 0.063) but not with PDR (P = 0.1). No consistent relationship was observed between smoking history and CPC or EPC levels. Together, these data show that EPC and CPC levels in the Medalists are decreased by the presence of CVD and nephropathy.
Characterization of SDF-1 in Medalists
Plasma SDF-1 levels were higher in the Medalists than age-matched controls (2,288 ± 492 vs. 1,934 ± 309 pg/mL, respectively; P < 0.01) (Fig. 2A). Interestingly, SDF-1 levels were also higher in Medalists with CVD and PDR compared with those not affected (CVD, 2,443 ± 512 vs. 2,195 ± 462 pg/mL, P < 0.01; PDR, 2,373 ± 509 vs. 2,192 ± 464 pg/mL, P = 0.02) (Fig. 2B and C). SDF-1 levels in Medalists without nephropathy (eGFR >45 mL/min per 1.73 m2) were higher (2,540 ± 568 vs. 2,192 ± 467 pg/mL; P = 0.06) than in those with nephropathy. SDF-1 levels did not differ according to neuropathy status within the Medalists (data not shown). The differences in SDF-1 between Medalists with or without complications remained significant even adjusting for age, total cholesterol, diastolic blood pressure, and HDL (data not shown). Circulating SDF-1 levels did not show an association with either EPC or CPC levels within the Medalist group (data not shown).

SDF-1, adiponectin, and sVCAM levels are higher in Medalists than controls, but SDF-1 does not differ with respect to vascular complications; PAI-1 and IGF-I are lower in Medalists than controls. SDF-1 plasma levels in (A) controls and Medalists, (B) Medalists by CVD, and (C) Medalists by PDR. D: IGF-I plasma levels in controls and Medalists. E: Negative correlation between CPCs and IGF-I levels in Medalists. Plasma levels of (F) PAI-1, (G) adiponectin, and (H) sVCAM-1 in controls and Medalists. Graphs show mean, SD. Significance represents Kruskal–Wallis test; P < 0.05. Medalists without CVD, n = 105 of 167; Medalists with CVD, n = 62 of 167; Medalists without PDR, n = 80 of 167; Medalists with PDR, n = 87 of 167; controls, n = 44; Medalists, n = 172.
SDF-1, adiponectin, and sVCAM levels are higher in Medalists than controls, but SDF-1 does not differ with respect to vascular complications; PAI-1 and IGF-I are lower in Medalists than controls. SDF-1 plasma levels in (A) controls and Medalists, (B) Medalists by CVD, and (C) Medalists by PDR. D: IGF-I plasma levels in controls and Medalists. E: Negative correlation between CPCs and IGF-I levels in Medalists. Plasma levels of (F) PAI-1, (G) adiponectin, and (H) sVCAM-1 in controls and Medalists. Graphs show mean, SD. Significance represents Kruskal–Wallis test; P < 0.05. Medalists without CVD, n = 105 of 167; Medalists with CVD, n = 62 of 167; Medalists without PDR, n = 80 of 167; Medalists with PDR, n = 87 of 167; controls, n = 44; Medalists, n = 172.
Correlation of Inflammatory and Oxidative Stress Markers With EPC or CPC Levels in the Medalists
Markers of inflammation and oxidative stress were evaluated in Medalists and compared with age-matched controls. Absolute monocyte numbers, plasma CRP, sVCAM-1, PAI-1, and adiponectin levels were assessed as markers for inflammation and urine isoprostane as a marker for oxidative stress. Mean plasma levels of PAI-1 and IGF-I in the Medalists were 30% and 22% lower than in controls, respectively (Fig. 2E and F; P = <0.01), while mean adiponectin and sVCAM-1 levels were 87% and 3.6% higher in the Medalists than in controls, respectively (Fig. 2G and H; P < 0.01). Adiponectin levels were increased in the Medalists compared with controls (odds ratio = 9.04; P < 0.001). This remained significant after correcting for BMI, LDL, HDL, medications, and sex (odds ratio = 7.6; P < 0.001). Within the Medalist group, however, there was no difference in adiponectin levels according to CVD, nephropathy, PDR, or neuropathy status (P = 0.6, 0.07, 0.7, and 0.5, respectively). There was no significant difference in urine isoprostane, plasma CRP, or circulating monocyte levels between Medalists and controls (data not shown). CPC levels negatively correlated with IGF-I levels (Fig. 2E; P < 0.02). Urine isoprostane positively correlated with CPC levels within the Medalists (P < 0.01), while plasma CRP positively correlated to CPC levels (P < 0.01). These correlations, however, did not remain significant after adjusting for age, total cholesterol, diastolic blood pressure, and HDL (data not shown). There was no correlation between EPCs and CPCs with SDF-1, PAI-1, sVCAM, adiponectin, or monocyte levels within the Medalist group.
Migration of Cultured PBMCs as a Potential Functional Assessment of CPCs and EPCs
Mobilization to a site of vascular injury is thought to be important in assessing the function of CPCs or EPCs. VEGF-induced cell migration was assessed using PBMCs, enriched for CPCs by culturing and demonstrated by increasing positive staining for CD34 and CD133 to ≥20%. Cells from Medalists migrated more than cultured PBMCs from controls both in the absence (2.88 ± 1.0 vs. 2.0 ± 0.4 cells/field, P = 0.01, respectively) and in the presence of VEGF (5.7 ± 1.5 vs. 3.9 ± 0.9 cells/field, P < 0.01, respectively) (Fig. 3). VEGF elicited a twofold increase in migration of cultured PBMCs from controls (1.97 ± 0.36 cells/field without VEGF vs. 3.99 ± 0.91 cells/field with VEGF; P < 0.001) (Fig. 3), which was similar to Medalists’ PBMCs (2.88 ± 0.97 cells/field without VEGF vs. 5.70 ± 1.48 cells/field with VEGF; P < 0.001) (Fig. 3). PBMC migration was comparable in Medalists regardless of CVD with VEGF (P = not significant) (Fig. 3B) and was not different according to PDR status (P = not significant) (Fig. 3B). No Medalist in this subset met the criteria for nephropathy.

Medalists’ PBMCs migrate more than age-matched controls regardless of VEGF stimulus. A: Representative pictures of PBMC migration through a Matrigel-coated invasion chamber. The number of PBMCs without VEGF (left panels) or with VEGF (right panels) was analyzed after 16 h, when membranes were counterstained with PI (red), and nuclei were counted at 20×. B: Migration is higher in Medalists than controls, regardless of VEGF. Migration in Medalists does not differ according to (C) CVD status or (D) PDR status. Mean and SD are shown. Student t test was used to generate P values. NPDR, nonproliferative diabetic retinopathy.
Medalists’ PBMCs migrate more than age-matched controls regardless of VEGF stimulus. A: Representative pictures of PBMC migration through a Matrigel-coated invasion chamber. The number of PBMCs without VEGF (left panels) or with VEGF (right panels) was analyzed after 16 h, when membranes were counterstained with PI (red), and nuclei were counted at 20×. B: Migration is higher in Medalists than controls, regardless of VEGF. Migration in Medalists does not differ according to (C) CVD status or (D) PDR status. Mean and SD are shown. Student t test was used to generate P values. NPDR, nonproliferative diabetic retinopathy.
Conclusions
Our findings demonstrated that the Medalists have comparable numbers of CPCs and EPCs with age-matched controls without diabetes and higher levels than young type 1 diabetic subjects and patients with type 2 diabetes of much shorter duration and similar age. This finding suggests that the Medalists are protected from the loss of CPCs and EPCs despite having metabolic abnormalities of diabetes such as hyperglycemia, hypertension, and dyslipidemia (9,11).
The preservation of CPC and EPC levels in the Medalists is consistent with the clinical findings of unusual chronic survival of these patients with type 1 diabetes, of whom a considerable percentage (35%) lacks significant microvascular complications. This study included a large subset of the Medalists with comparable clinical characteristics as the whole cohort, which now numbers over 800 subjects. The maintenance of EPCs in the Medalists did correlate with HDL, total cholesterol, and blood pressure, whereas EPCs modestly correlated with age, as some studies have reported (34).
However, analysis within the Medalist group showed decreased EPC and CPC levels in the presence of CVD and nephropathy, consistent with previous reports on the negative effects of these pathologies on CPC levels (11). It is interesting to note that the EPC and CPC levels among the Medalists correlated with known risk and protective factors for nephropathy and CVD, such as blood pressure and HDL, but not with any factors for PDR or neuropathy. These findings would suggest that high levels of EPCs and CPCs may be markers for protection from CVD and DN in type 1 diabetes, but not for DR or neuropathy. The findings that EPC levels are higher in those Medalists with the least history of PVD further support the results with CVD, confirming the idea that EPC may contribute to the decrease of CVD or PVD development. We reported previously that the presence of risk factors for CVD among Medalists is similar to established risk factors for the general population. The negative correlation between CPCs and EPCs and blood pressure in the Medalists was also consistent with these findings. In contrast, the pattern for microvascular complications is unusual where HbA1c, a major marker of glycemic control, does not correlate with the presence of DR or neuropathy in the Medalists. These complications also did not correlate with CPCs or EPCs in the Medalists, suggesting that the protective markers or factors are dissimilar between microvessels and cardiovascular tissues in patients with type 1 diabetes. Circulating SDF-1 levels in Medalists were higher than in age-matched controls, which suggests the speculation that this chemokine could induce EPC and CPC secretion into the circulation, but their sensitivity to SDF-1 may be reduced. This speculation is derived from the fact that SDF-1 mediates its actions partially by activating the p-Akt pathway, which can be inhibited by hyperglycemia or diabetes possibly through the activation of protein kinase C (35,36). Furthermore, SDF-1 and EPC levels in the Medalists showed an inverse trend with vascular complications: those with vascular complications had higher SDF-1 but fewer EPCs and vice versa. These data suggested that resistance to SDF-1 may be present in diabetes and result in lower EPC and CPC secretion in response to vascular injury. Further studies will be needed to characterize the signaling response to SDF-1 in EPCs and CPCs of diabetic patients with and without vascular complications.
Analysis of oxidative stress and inflammatory markers in the plasma and urine suggested that CPC numbers, after adjusting for confounding factors, correlated with isoprostane and CRP, although it is likely that the effect is related to other systemic factors such as age, lipids, and blood pressure. However, the reduction of PAI-1 and elevation in adiponectin and sVCAM levels indicated that the Medalists as a group exhibited a lower inflammatory state than their age-matched controls, which is contrary to expectations for diabetic patients. These findings again emphasize the unusual metabolic properties of Medalists, which likely contribute to their chronic survival. Interestingly, plasma IGF-I levels are lower in the Medalists versus controls and inversely correlated to CPCs and appear to be higher in those Medalists with poor renal function. It is not surprising that IGF-I is lower in people with diabetes since plasma IGF-I levels are mainly derived from the liver due to growth hormone actions. However, there is growth hormone resistance in diabetes, especially with poor glycemic control. In addition, IGF-I levels are reported to be increased in people with poor renal function due to increases in IGF-binding proteins (4). However, the unexpected finding of inverse correlation of CPCs with IGF-I is difficult to explain. Information on IGF-binding protein levels are needed in order to clarify the systemic IGF-I levels and their relativity to CPCs and EPCs. Studies on IGF-I’s actions on CPC migration and activation will also be very helpful to understand this finding.
One weakness of our study was our inability to culture EPCs or CPCs in sufficient numbers to assay their function in vitro. The results from the migration studies using Medalists’ PBMCs exhibited greater response to VEGF as a stimulant, which suggested that the PBMCs/CPCs had VEGF receptors and could be early angioblasts since they express both VEGFR2 and CD133. In addition, the above-normal responses of PBMCs/CPCs to VEGF also suggest that the proangiogenesis actions of these cells from the Medalists are probably not dysfunctional.
In summary, this study demonstrated that normal circulating CPC and EPC levels are present in the Medalists even after chronic exposure to hyperglycemia. CPCs and EPCs may contribute to the protective functions on the development of cardiovascular complications and nephropathy. Interestingly, the elevated SDF-1 levels found in the Medalists suggest a possible mechanism by which the Medalists are able to maintain normal CPC and EPC levels. It is also possible that conditions that are increasing the risks of CVD could be activating PBMCs, including CPCs, to lower their numbers. These results suggest that the maintenance of CPCs and EPCs could be markers for lower risk of CVD and nephropathy and enhanced survival in type 1 diabetic patients.
A slide set summarizing this article is available online.
S.L.H. and J.H.G. contributed equally to this study.
Article Information
Acknowledgments. The authors thank Honzer Chen and Kai Chen from Joslin Diabetes Center for their technical support; Sara Turek and Stephanie Hastings from Joslin Diabetes Center and Ann Marie Tolson, Jerry Cavallerano, and Hanna Kwak from the Beetham Eye Institute for their assistance in clinical research; the Beetham Eye Institute staff for ocular evaluation of the study participants; Amy Wagers from Joslin Diabetes Center for her support with flow cytometry; the Specialized Assay Core at Joslin Diabetes Center for performing the laboratory assays on the plasma and urine; and Patti Muehter from Joslin Diabetes Center for editorial assistance in the preparation of the manuscript.
Funding. This research was funded by National Institutes of Health grant 5P30 DK36836 and American Diabetes Association grant 7-10-MERK-04.
Duality of Interest. No potential conflicts of interest relevant to this article were reported.
Author Contributions. S.L.H. and J.H.G. researched data and wrote the manuscript. L.C. and I.-H.W. researched data. J.K.S. reviewed and edited the manuscript. H.A.K. and G.L.K. reviewed and edited the manuscript and contributed to discussion. G.L.K. is the guarantor of this work and, as such, had full access to all the data in the study and takes responsibility for the integrity of the data and the accuracy of the data analysis.
Prior Presentation. This work was presented at the 71st Scientific Sessions of the American Diabetes Association, San Diego, CA, 24–28 June 2011, and at the Complications of Diabetes Keystone Meeting, Boston, MA, 11–16 March 2012.