


Paralleling the rise of pediatric obesity, the prevalence of impaired glucose tolerance (IGT) and type 2 diabetes (T2D) is increasing among youth. In this study, we asked whether the co-occurrence of risk alleles in or near five genes modulating insulin secretion (TCF7L2 rs7903146, IGF2BP2 rs4402960, CDKAL1 rs7754840, HHEX rs1111875, and HNF1A rs1169288) is associated with a higher risk of IGT/T2D in obese children and adolescents.
We studied 714 obese subjects (290 boys and 424 girls; mean age 13.6 ± 3.1 years; mean z score BMI 2.2 ± 0.4) and evaluated the insulin secretion by using the oral minimal model and, in a subgroup of 37 subjects, the hyperglycemic clamp. Also, 203 subjects were followed up for a mean of 2.1 years.
We observed that the increase of risk alleles was associated with a progressive worsening of insulin secretion (P < 0.001) mainly due to an impairment of the dynamic phase of insulin secretion (P = 0.004); the higher the number of the risk alleles, the higher the chance of progression from normal glucose tolerance (NGT) to IGT/T2D (P = 0.022). Also, for those who were IGT at baseline, a higher risk score was associated with a lower odds to revert to NGT (P = 0.026).
Obese children and adolescents developing IGT/T2D have a higher genetic predisposition than those who do not show these diseases, and this predisposition is mainly related to gene variants modulating the early phase of insulin secretion. Although these data are very interesting, they need to be replicated in other cohorts.
Introduction
Type 2 diabetes (T2D) has emerged as one of the greatest global health challenges of the 21st century, projected to affect roughly one out of three individuals born in the year 2000 during their lifetime (1). Recent population-based data from the Search for Diabetes in Youth (SEARCH) Study indicate that T2D is diagnosed in about 3,700 obese youths annually in the U.S. (2,3). Also, using the most recent population-based estimates of diabetes incidence and prevalence and taking into account demographic changes over time, Imperatore et al. (4) reported that in the next 40 years, the number of youths with T2D is projected to increase by 49%. Onset of T2D in childhood or adolescence heralds many years of disease and an increased risk of the full range of both micro- and macrovascular complications that will occur when affected individuals are still relatively young. Therefore, it is imperative to identify early young subjects at increased risk of T2D when they are in the prediabetic state, particularly because the tempo of progression from impaired glucose tolerance (IGT) to full blown diabetes seems to be faster in youth than in adults (5–8).
In the last decade, genome-wide association studies (GWAS) have discovered a large number of T2D susceptibility loci (9–13). Among them, many are near or inside genes coding for proteins involved in insulin secretion (14,15). Numerous studies mainly performed in adults showed that genetic risk scores obtained by combining the risk alleles (i.e., the alleles associated with the disease) of the single nucleotide polymorphisms (SNPs) associated with T2D are associated with an enhanced diabetes risk (16–23). However, the predictive power of any risk allele scores is yet insufficient to substitute or largely improve the predictive power of known clinical risk factors (16,24).
Although it is plausible to think that T2D and related metabolic traits have a substantially larger heritable component at younger than older ages, genetic studies in prediabetic children and adolescents are missing. To gain insights into the potential genetic underpinnings of IGT/T2D in obese children, we analyzed a panel of five gene variants robustly associated with T2D susceptibility identified in adults by GWAS (9–13). The rationale for selecting these gene variants is based on studies recently performed in human islets indicating that these genes are involved in the release of insulin granules from the β-cell (25). For instance, variants near the TCF7L2 gene were associated with reduced depolarization-evoked insulin exocytosis and susceptibility, and variants near the HHEX gene were associated with granule docking (25). Although previous studies in the pediatric population have shown an association between some of these SNPs and fasting glucose and insulin levels (26,27), so far there are no studies in youth assessing whether or not these risk alleles confer a high susceptibility to develop early-onset IGT. This study aims at filling this gap of knowledge; in particular, herein, we sought 1) to examine whether in obese youth a genetic risk score for β-cell dysfunction from five SNPs known to modulate insulin secretion (TCF7L2 rs7903146, IGF2BP2 rs4402960, CDKAL1 rs7754840, HHEX rs1111875, and HNF1A rs1169288) might be associated with a higher risk to show prediabetes and T2D, 2) to determine the effects of these genetic variants on changes in insulin secretion and sensitivity, and 3) to assess whether their co-occurrence might predict changes in glucose tolerance over time in obese youth.
Research Design and Methods
Subjects were recruited from a multiethnic cohort participating in the Yale Pathophysiology of Type 2 Diabetes in Youth Study, a long-term project aimed to study early alterations in glucose metabolism in obese children and adolescents. In order to be eligible, subjects needed to be obese and not to take medications that affect glucose metabolism (i.e., insulin and metformin, the only two medications approved to treat T2D in pediatrics). The study was approved by the Human Investigations Committee of the Yale School of Medicine. Parental informed consent and child assent were obtained from all participants. From its original focus on determining the associations between early alterations in insulin sensitivity and secretion and the presence of IGT in obese children and adolescents, the Yale Pathophysiology of Type 2 Diabetes in Youth Study was broadened in scope to assess the genetic susceptibility and the identification of precursors of dysglycemia as they move through adolescence. The need for a follow-up study grew out of our clinical observational study indicating the rather unstable and vulnerable state of prediabetes in youngsters (28). Consequently, the study was expanded to include a second oral glucose tolerance test (OGTT) at ∼2 years of follow-up. The rationale for the 2-year time interval was based on a previous study indicating that changes in categories of glucose tolerance in obese adolescents are likely to occur over a relatively short period (28).
As indicated in Supplementary Table 1, we studied 714 obese children and adolescents (290 boys and 424 girls; mean age 13.6 ± 3.1 years; mean z score BMI 2.2 ± 0.4) referred to the Yale Pediatric Obesity Clinic. To evaluate the effect of the gene variants on the risk of developing prediabetes, 203 subjects received a second OGTT after a follow-up of 2.1 ± 1.2 years. During the follow-up time, all participants received standard nutritional guidance and recommendations for physical activity. The same guidance was provided to all the subjects attending the obesity clinic. Unfortunately, the follow-up rate was relatively low because, due to budgetary constraints, we were forced to limit the number of OGTTs performed yearly. Additionally, it is likely that the low returned rates may be due to the fact that subjects are followed in the setting of a clinic-based pediatric weight management program. Further, most of these children come from economically disadvantaged families, which may contribute to the high dropout rate. It should be noted that our dropout rate is very consistent with that from other studies demonstrating high rates of attrition from pediatric weight management programs, ranging from 27 to 73% (29). To illustrate the number of children participating in the cross-sectional and longitudinal arms, we created a flowchart (Supplementary Fig. 1).
Assessment of Insulin Sensitivity and Secretion: The Oral Glucose Minimal Model
Subjects were studied at the Yale Center for Clinical Investigation at 8:00 a.m., after a 10-h overnight fast (25). A 3-h OGTT (1.75 g/kg body weight, up to 75 g) was performed in all children and adolescents, as previously reported (29,30). Two baseline samples were obtained at –15 and 0 min for measurements of plasma glucose, insulin, and C-peptide. Thereafter, flavored glucose (Orangedex; Custom Laboratories, Baltimore, MD) was given orally, and blood samples were obtained at 10, 20, and 30 min and every 30 min thereafter for 180 min for the measurements of plasma glucose, insulin, and C-peptide. Glucose tolerance status was defined according to American Diabetes Association guidelines (31).
The insulin sensitivity (SI) was estimated from plasma glucose and insulin concentrations measured during the 3-h OGTT using the Oral Glucose Minimal Model (30–32). This index has been validated against the euglycemic clamp, showing a correlation of 0.81 (P = 0.001) (32). β-Cell responsivity indices were estimated from plasma glucose and C-peptide concentrations measured during the OGTT by using the oral C-peptide minimal model (32–36).
The model assumes that insulin secretion is made up of two components. The dynamic component is likely to represent secretion of promptly releasable insulin and is proportional to the rate of increase of glucose concentration through a parameter, Φd (10,−9), which defines the dynamic responsivity index. The static component derives from the provision of new insulin to the releasable pool and is characterized by a static index, Φs (10−9 min−1), and by a delay time constant, T (min). From Φd and Φs, one can also calculate a single, overall β-cell responsivity index, Φtotal (10−9 min−1). Finally a basal β-cell responsivity index, Φb (10−9 min−1), can also be calculated from basal C-peptide and glucose concentrations. In order to determine whether β-cell function is appropriate for the degree of insulin resistance, Φtotal can be expressed in relation to insulin sensitivity through the disposition index, DI = Φtotal ⋅ SI (37).
Hyperglycemic Clamp
To quantify insulin secretion, plasma glucose concentration was raised to 11 mmol/L by infusion of 20% dextrose at variable rates and kept at that value for 120 min (1). Samples were drawn at 2, 4, 6, 8, and 10 min and every 20 min thereafter for glucose, insulin, and C-peptide concentrations. Incremental first-phase concentration of insulin and C-peptide was calculated as the mean of 2-, 4-, 6-, 8-, and 10-min values minus the mean of −20, −10, and 0 fasting levels. Mean second-phase concentration of insulin and C-peptide was calculated as the mean value of 60 and 120 min, as previously described (5,37,38). Only 37 subjects volunteered to have this test as it was offered to them as an option.
Genotyping
We genotyped five SNPs in five genes that in recent cross-sectional GWAS have shown consistent association with T2D and were found to modulate insulin secretion: TCF7L2 rs7903146, CDKAL1 rs7754840, IGF2BP2 rs4402960, HHEX rs1111875, and HNF1A rs1169288 (14). Genomic DNA was extracted from peripheral blood leukocytes. Genotyping was performed with the use of a matrix-assisted based laser desorption-ionization time of flight mass spectrometry on the MassARRAY platform (Sequenom) (16). We obtained an average genotyping success rate of >95% and an average genotyping accuracy of >98% by regenotyping 11% of the samples using the Sequenom platform. The allele frequencies were consistent with those shown in similar ethnic groups in the Allele Frequency Database (ALFRED, http://alfred.med.yale.edu) as well as in HAPMAP (http://hapmap.ncbi.nlm.nih.gov/) (Supplementary Table 1). Within each ethnic group, there was no evidence against the null hypothesis that the genotype distribution was in Hardy-Weinberg equilibrium for all of the variants (all P > 0.003) (Supplementary Table 1).
Biochemical Analyses
Plasma glucose was determined using the YSI 2700 Analyzer. Plasma insulin was measured by the Linco RIA, which has <1% cross-reactivity with C-peptide and proinsulin. Plasma C-peptide was assayed with an assay made by Diagnostic Product (Los Angeles, CA).
Statistical Analyses
Distribution of continuous variables was examined for skewness, and variables were logarithmically transformed when appropriate. A χ2 test was used to assess the Hardy-Weinberg equilibrium for each of the studied SNPs and to compare proportions. The genetic score was calculated by risk allele counting. In each ethnic group, the association between the genetic score and the main outcome (Φtotal) and secondary (2-h glucose, DI, and SI) outcomes was assessed by a general linear model using an additive model, and age, sex, and z score BMI were used as covariates. Age, sex, and BMI expressed as z score were chosen as covariates because insulin secretion is influenced by changes occurring with age. Also, those physiological modifications of insulin sensitivity, as a consequence of insulin secretion, are different between males and females and are exacerbated by the obesity degree. This approach has been used previously in other pediatric association studies (27). No other covariates have been investigated. To assess whether there was an interaction between the gene score and the ethnicity in modulating Φtotal or DI, a model including the ethnicity and gene score separately and an interaction term (gene score × ethnicity) including age, sex, and z score BMI as covariates was run. The odds of showing IGT according to the number of risk alleles at baseline was evaluated by a logistic regression analysis, and age, sex, and z score BMI were used as covariates. To evaluate whether the addition of genetic data to BMI degree was associated with a higher risk of showing alteration of glucose tolerance, we divided the population into quartiles of BMI (first quartile ≤28.7 kg/m2, second quartile between 28.7 and 33.0 kg/m2, third quartile between 33.0 and 38.5 kg/m2, and fourth quartile ≥38.5 kg/m2) as well as by gene score groups (first group gene score ≤2, second group gene score between 3 and 5, and third group gene score ≥6). Thereafter, we tested the differences of IGT prevalence across the three genetic score groups in each BMI quartile using a χ2 test. Also, to explore the additive effect between BMI and the number of risk alleles on the development of IGT, a logistic regression model was run, and the odds for subjects carrying more than six risk alleles of showing IGT across the BMI groups was calculated.
In the longitudinal analysis, the three ethnic groups were merged and the risk at follow-up of normal glucose tolerance (NGT) subjects to progress to IGT and for IGT subjects to remain IGT or progress to T2D was calculated by using a logistic regression model by including age, sex, ethnicity, baseline z score BMI, Δ z score BMI, and follow-up time as covariates. Statistical analyses were performed with SPSS (19.0 for Windows; SPSS Inc., Chicago, IL). All data were expressed as mean ± SD or median and interquartile range.
Results
The study population consisted of three ethnic groups (316 Caucasians, 188 African Americans, and 210 Hispanics) and included 530 (74.4%) subjects with NGT and 184 (25.6%) with IGT. Family history of T2D was collected in all subjects at recruitment. All participants underwent a 3-h OGTT, whereas a subgroup of 37 obese youths (16 Caucasians, 10 African Americans, and 11 Hispanics; 17 boys and 20 girls; mean age 13.6 ± 2.9 years; BMI 35.3 ± 6.9 kg/m2; z score BMI 2.2 ± 0.4) agreed to undergo a hyperglycemic clamp. To evaluate potential changes in glucose tolerance, in a subgroup of 203 (36%) subjects (115 NGT and 88 IGT) who came back for a follow-up visit, a second OGTT was performed after a mean 2.1 ± 1.2 years. A flowchart showing the study participants is shown in Supplementary Fig. 1. Out of 115 obese youths who were NGT at baseline, 103 (90.5%) remained NGT and 12 (10.5%) progressed to IGT. Of 88 subjects who were IGT at baseline, 53 (60%) converted to NGT, 31 (35%) remained IGT, and 4 (4.5%) progressed to T2D at follow-up.
Effect of a Genetic Score on the Risk of IGT at Baseline
The prevalence of IGT was significantly different across the genetic risk score groups in all the ethnicities; the higher the genetic score, the higher the prevalence of IGT (Fig. 1). In particular, the odds to show prediabetes per additional risk allele was odds ratio (OR) 1.454 (95% CI 1.207–1.751) in Caucasians, 1.541 (1.210–1.962) in African Americans, and 1.458 (1.182–1.799) in Hispanics. To analyze whether genetic risk factors would further increase the risk imposed by a high BMI, we stratified the entire cohort by quartiles of BMI and within each quartile by increasing genetic risk score and then examined the prevalence of IGT across the genetic score group for each BMI quartile as reported in Fig. 2. In each BMI quartile group, we found a significant increase in IGT prevalence; therefore independently of BMI quartile group, the presence of six or more risk alleles resulted in a significant increase of having IGT, and most importantly, the risk of showing IGT according to the number of risk alleles increased across the BMI quartiles. In particular, carriers of more than six risk alleles in each BMI quartile compared with the first quartile had an OR to show IGT of 6.99 in the second BMI quartile (95% CI 1.58–30.91; P = 0.10), 4.60 in the third BMI quartile (1.26–16.77; P = 0.02), and 5.63 in the fourth BMI quartile (1.65–19.17; P = 0.006).

The prevalence of IGT according to the number of risk alleles in the three ethnic groups.
The prevalence of IGT according to the number of risk alleles in the three ethnic groups.
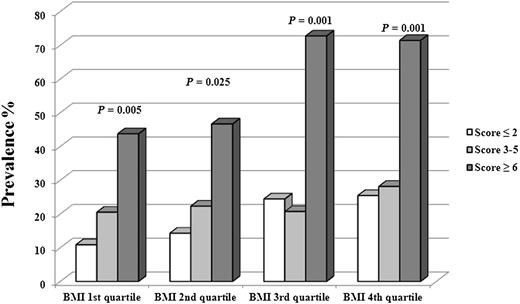
The prevalence of IGT subjects in the entire cohort divided into quartile of BMI (first quartile ≤28.7 kg/m2, second quartile between 28.7 and 33.0 kg/m2, third quartile between 33.0 and 38.5 kg/m2, and fourth quartile ≥38.5 kg/m2) as well as by gene score groups (first group gene score ≤2, second group gene score between 3 and 5, and third group gene score ≥6). The P values refer to the prevalence of IGT according to the number of risk alleles in each quartile group.
The prevalence of IGT subjects in the entire cohort divided into quartile of BMI (first quartile ≤28.7 kg/m2, second quartile between 28.7 and 33.0 kg/m2, third quartile between 33.0 and 38.5 kg/m2, and fourth quartile ≥38.5 kg/m2) as well as by gene score groups (first group gene score ≤2, second group gene score between 3 and 5, and third group gene score ≥6). The P values refer to the prevalence of IGT according to the number of risk alleles in each quartile group.
Also, the genetic score significantly correlated with the family history of T2D (P < 0.001); thus, with the increasing of risk allele number, we found a significant increase in the prevalence of a positive family history (Supplementary Table 1).
Risk Score and Insulin Secretion
We found a significant association between the number of the risk alleles and the main outcome, the β-cell glucose responsiveness expressed as Φtotal (Fig. 3). In fact, as shown in Fig. 3, in the three ethnic groups, we observed a significant and positive association between the genetic score and measures of insulin secretion (Φtotal), and similarly, the genetic score was associated with the DI values (Supplementary Table 1). Also, the association between the gene score and log Φtotal remained statistically significant also after multiple comparisons adjustment (significant value P = 0.013). There was no interaction between ethnicity and gene score in modulating the Φtotal (P = 0.49) or DI (P = 0.12). Of note, no association was documented with SI (Supplementary Table 1), suggesting that the effect of the risk score on insulin secretion was independent of insulin sensitivity. The association between the genetic score and β-cell function indexes was further evaluated by using hyperglycemic clamp–derived measures of insulin secretion. As shown in Supplementary Fig. 2, we documented a significant association between the gene score and the first-phase insulin secretion (P = 0.004); no association was found between the gene score and the second-phase insulin secretion (P = 0.75).

Association between the genetic risk score and log Φtotal in the three ethnic groups (P values adjusted for age, sex, z score BMI, and glucose tolerance).
Association between the genetic risk score and log Φtotal in the three ethnic groups (P values adjusted for age, sex, z score BMI, and glucose tolerance).
Follow-up Cohort
We also determined whether the co-occurrence of risk alleles might increase the risk of progression from NGT to IGT or for IGT subjects to remain IGT or progress to diabetes. The OR of progressing to IGT in those youths who were NGT at baseline was 1.89 (95% CI 1.099–3.265; P = 0.022) per each risk allele, whereas the OR of remaining IGT or progressing to T2D at follow-up in those youths who were IGT at baseline was 1.44 (1.046–1.983; P = 0.026) per risk allele. In those subjects who were IGT at baseline, to further illustrate the dynamic changes in glucose tolerance status by risk allele, we calculated the prevalence of subjects that converted from IGT to NGT and that stayed IGT or converted to T2D for each risk allele. As shown in Fig. 4, with increasing of risk alleles, the prevalence of subjects converting from IGT to NGT decreased significantly, and the prevalence of subjects remaining IGT or progressing to T2D increased significantly.
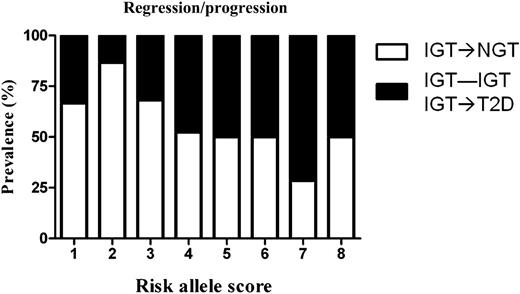
Changes of glucose tolerance status at follow-up of subject IGT at baseline. The white part of the bars describes those who moved from IGT to NGT, and the black part of the bars shows those who moved from NGT to IGT/T2D.
Changes of glucose tolerance status at follow-up of subject IGT at baseline. The white part of the bars describes those who moved from IGT to NGT, and the black part of the bars shows those who moved from NGT to IGT/T2D.
Conclusions
The current study provides, for the first time, insights about the importance of the association of common genetic variants with prediabetes in obese youth. Herein, we show that in obese youth, the combined effect of five common variants in or near genes involved in the pathway of insulin release is associated with a reduced insulin secretion, a higher odds of demonstrating IGT, and a higher risk over time to develop IGT and T2D. In fact, the co-occurrence of the risk alleles is associated with odds of showing IGT between 1.454 and 1.551 independent of age, sex, and BMI; also, subjects carrying multiple risk alleles have an almost 90% increased risk of developing IGT. Thus, these data clearly show that obese children and adolescents carrying gene variants affecting the early phase of insulin secretion are more prone to developing IGT; these data are also consistent with our previous finding in obese youth that an impaired early-phase insulin secretion is a required condition to develop IGT (5).
Previously we showed that the degree of obesity represents one of the most important risk factors for T2D in youth (28). In this study, we further demonstrate that the risk alleles have an additive effect on the risk of IGT related to adiposity. In fact, in each BMI quartile category, the presence of six or more risk alleles induces a significant increased risk of demonstrating IGT compared with those with the same degree of obesity.
We also show that carrying multiple risk alleles provides subjects who were IGT at baseline with a higher probability to remain IGT or progress to T2D at follow-up. In fact, the OR of remaining/progressing to IGT/T2D at follow-up was 1.44, independent of age, follow-up time, sex, BMI, and changes in BMI.
Consistent with previous studies (39,40), herein we show that the studied variants influence the β-cell function possibly by affecting the early, dynamic phase of insulin secretion; indeed, the higher the number of risk alleles, the lower the β-cell response to glucose administered either orally or intravenously. Our observations suggest that obese youth who develop IGT or T2D tend to carry a high number of risk alleles especially affecting processes modulating the rapid granule recruitment and exocytosis (40).
Although the natural history of prediabetes is not yet well known in youth, we report the rather dynamic nature of these conditions in obese children. For the first time, we show that those children that converted back to NGT had a low number of risk alleles, whereas those that either remained IGT or progressed to T2D were enriched with a high number of risk alleles. Although these findings need to be extended to larger cohorts followed over a longer time, the data strongly suggest the importance of genetic factors implicated in the development of early-onset T2D in youth.
Although ethnicity seems not to influence the association between the studied gene variants and glucose dysregulation (the association between the gene score and the studied outcomes are actually evident in all the ethnicities), African American obese youths with a high risk score tended to have a higher risk of having IGT than Caucasians and Hispanics. Also, this would help explain why African American youth, in spite of a more favorable adipose tissue disposition, characterized by a low visceral fat and an almost absent intrahepatic fat accumulation (41), still show a higher risk of developing IGT/T2D than Caucasian and Hispanic obese kids.
We acknowledge that this study has a number of limitations. One limitation is that we elected to analyze only five SNPs in or near genes encoding for protein mainly involved in insulin secretion. Although there are >60 SNPs shown to be associated with T2D, the effects of which are not taken into account in our analysis, it is rather remarkable to see such a high predictive value with only five SNPs. The sample size of the cohort is rather small, and the study lacks replication in another independent cohort of obese children. The latter is a critical point, since replication helps ensure that a genotype-phenotype association observed in an association study represents a credible association and is not a chance finding or an artifact due to uncontrolled biases. Also the small sample size did not allow us to run any gene-gene interaction or haplotype analyses. Further, we do acknowledge that the high attrition observed in our study is a strong limitation and that this data should be interpreted as preliminary needing further future evaluation in longitudinally designed studies that dedicate significant effort and resources aimed at avoiding high attrition rates among these participants. Also, the high attrition rates did not allow us to analyze the data according to ethnicity; this analysis would have provided more information about the gene-race interaction in the modulation of insulin secretion. On the other hand, to the best of our knowledge, this is the only existing cohort comprehensive of children and adolescents with and without IGT and T2D carefully phenotyped with regard to insulin secretion and sensitivity and followed up over time. Another limitation is that we did not evaluate the effect of other covariates besides age, sex, and BMI in our models. Also, the strengths of the study include 1) the use of state-of-the-art measures of insulin secretion, 2) the study of a young population in which the effects of aging on insulin secretion and sensitivity are not evident yet, and 3) the multiethnic background of the cohort.
In conclusion, obese children and adolescents developing IGT or T2D have a higher genetic predisposition than those who do not show these diseases, and this susceptibility is mainly related to gene variants modulating the early, dynamic phase of insulin secretion.
Article Information
Acknowledgments. The authors are grateful to the patients and their families as well as to the Yale Center for Genome Analysis and the Yale Center for Clinical Investigation and Hospital Research Unit personnel.
Funding. C.G. is funded by the European Society of Pediatric Endocrinology (ESPE Long-Term Research Fellowship 2011). N.S. is funded by the American Heart Association (AHA) (13SDG14640038). S.C. is funded by the National Institutes of Health (NIH) (grants R01-HD-40787 and R01-HD-28016) and the American Diabetes Association (Distinguished Clinical Scientist Awards from the American Diabetes Association, DK-49230). Work at Lund University Diabetes Centre was funded by a Research Council grant to L.G. (DNr521-2010-3490). This work was also made possible by DK-045735 to the Yale Diabetes Endocrinology Research Center and by Clinical and Translational Science Awards Grant UL1-RR-024139 from the National Center for Advancing Translational Sciences, a component of the NIH, and NIH Roadmap for Medical Research.
The contents of this scientific contribution are solely the responsibility of the authors and do not necessarily represent the official view of the NIH.
Duality of Interest. No potential conflicts of interest relevant to this article were reported.
Author Contributions. C.G. and N.S. analyzed and reviewed the data and wrote and edited the manuscript. C.D.M., L.G., C.C., M.M.S., E.D., B.P., and A.E.B. researched the data. H.Z. analyzed the data. S.C. reviewed the data and wrote and edited the manuscript. S.C. and N.S. are the guarantors of this work and, as such, had full access to all the data in the study and take responsibility for the integrity of the data and the accuracy of the data analysis.
