


To compare the performance of two glomerular filtration rate (GFR)-estimating equations in predicting the risk of all-cause and cardiovascular mortality in type 2 diabetic patients.
We followed 2,823 type 2 diabetic outpatients for a period of 6 years for the occurrence of all-cause and cardiovascular mortality. GFR was estimated using the four-variable Modification of Diet in Renal Disease (MDRD) study equation and the Chronic Kidney Disease Epidemiology Collaboration (CKD-EPI) equation.
At baseline, an estimated GFR (eGFR) <60 mL/min/1.73 m2 was present in 22.0 and 20.2% of patients using the MDRD study equation and the CKD-EPI equation, respectively. A total of 309 patients died during the follow-up (152 patients from cardiovascular causes). Both creatinine-based equations were associated with an increased risk of all-cause and cardiovascular mortality. However, the CKD-EPI equation provided a more accurate risk prediction of mortality than the MDRD study equation. Receiving operating characteristic curves showed that the areas under the curve (AUCs) for all-cause mortality (AUC 0.712 [95% CI 0.682–0.741]) and cardiovascular mortality (0.771 [0.734–0.808]) using eGFRCKD-EPI were significantly greater (P < 0.0001 by the z statistic) than those obtained by using eGFRMDRD (0.679 [0.647–0.711] for all-cause mortality and 0.739 [0.698–0.783] for cardiovascular mortality).
Our findings suggest that the estimation of GFR using the CKD-EPI equation more appropriately stratifies patients with type 2 diabetes according to the risk of all-cause and cardiovascular mortality compared with the MDRD study equation.
Chronic kidney disease (CKD) is a major public health problem because its prevalence is rapidly increasing worldwide and it is strongly associated with increased risks of end-stage renal disease, death, cardiovascular disease (CVD), and hospitalization (1–5). Glomerular filtration rate (GFR) is the best overall measure of kidney function. Current diagnosis, evaluation, and management of CKD routinely rely on estimates of GFR (eGFRs) usually derived from creatinine-based equations such as the Modification of Diet in Renal Disease (MDRD) study equation, which incorporates information on serum creatinine concentration, age, sex, and race (1,6,7). This equation is the most commonly used method for estimating kidney function in routine clinical practice. Its prognostic value has been validated in several studies and populations (1,6,7). Decreased eGFRMDRD has been shown to be an important risk factor for death, CVD events, and other adverse clinical outcomes, specifically in patients with a GFR level <60 mL/min/1.73 m2 (1–5). However, despite its widespread use, it is known that the major limitations of the MDRD study equation are imprecision and systematic underestimation of measured GFR (bias) at higher values (1,6,7).
The Chronic Kidney Disease Epidemiology Collaboration (CKD-EPI) investigators recently developed and validated a new equation to improve the estimation of GFR (eGFRCKD-EPI) by using a large database pooled from 10 studies (8). This equation, which uses the same four variables as the MDRD study equation (i.e., serum creatinine level, age, sex, and race), has been shown to be more precise and accurate than the MDRD study equation in estimating measured GFR, especially at higher GFR values (8). Improved accuracy of the CKD-EPI equation could have important implications for public health and clinical practice (8). In addition, some large population-based cohort studies have recently shown that the CKD-EPI equation also has superior accuracy in classifying individuals at risk for CVD events and death compared with the MDRD study equation (9–11).
However, the CKD-EPI equation might not work equally well in people at high CVD risk, such as type 2 diabetic individuals. Whether the use of the CKD-EPI equation provides more accurate prognostic information than the MDRD study equation with respect to the risk of all-cause and CVD mortality in patients with type 2 diabetes is currently unknown. Thus, the aim of this prospective, longitudinal study was to compare the performance of the MDRD study equation and the CKD-EPI equation in predicting all-cause and CVD mortality in a large sample of type 2 diabetic individuals during a follow-up period of 6 years.
RESEARCH DESIGN AND METHODS
The study was performed within the frame of the Verona Diabetes Study, an observational longitudinal study on chronic complications in type 2 diabetic patients attending the diabetes clinic at the University Hospital of Verona (12,13). In brief, data included in this analysis are based upon the cohort of Caucasian type 2 diabetic outpatients (n = 2,942), who were recruited over the period of January 2000–December 2001 and then followed up until 30 September 2007. The study participants were periodically seen at the diabetes clinic (every 6–12 months) for routine medical examinations of glycemic control, kidney function parameters, and chronic complications of diabetes. The ascertainment at the end of follow-up (30 September 2007) for the eligible cohort was ∼97%. Participants who attended the follow-up examinations (n = 2,823) were essentially similar to those who were initially eligible (n = 2,942) and to those who did not attend the follow-up examinations (n = 119) in terms of demographic variables, glycemic control, and kidney function parameters. Thus, 2,823 type 2 diabetic patients were included in the final analysis. The local ethics committee approved the study protocol. All participants gave their informed consent.
Clinical and laboratory variables
BMI was calculated by dividing weight in kilograms by the square of height in meters. Blood pressure was measured in duplicate by a physician with a mercury sphygmomanometer (at the right upper arm using an appropriate cuff size) after the patient had been seated quietly for at least 5 min. Subjects were considered to have hypertension if their blood pressure was ≥140/90 mmHg or if they were taking any antihypertensive drugs. Information on medical history and smoking status was obtained from all patients by interviews during medical examinations. Detailed information regarding changes during the follow-up in the use of cardioprotective medications was not currently available in our informatic database.
Venous blood was drawn in the morning after an overnight fast. Serum creatinine, lipids, and other biochemical blood measurements were determined by standard laboratory procedures (DAX 96; Bayer Diagnostics, Milan, Italy). LDL cholesterol was calculated by the Friedewald equation. A1C was measured by an automated high-performance liquid chromatography analyzer (Bio-Rad Diamat, Milan, Italy); the upper limit of normal for our laboratory was 5.6%.
Serum creatinine measurements were performed at a central laboratory and measured using the kinetic alkaline picrate (modified Jaffè) method. Serum creatinine values subsequently were calibrated and standardized according to the following equation: −0.166 + 1.10 × (measured serum creatinine [mg/dL]). To derive this equation, ∼200 frozen samples previously analyzed using a non–isotope-dilution mass spectrometry method were reassayed by an non–isotope-dilution mass spectrometry reference method, as reported in our earlier study (14). GFR was estimated from calibrated serum creatinine values using the four-variable MDRD study equation (15) as follows: eGFR = 175 × (serum creatinine−1.154) × (age−0.203) × 1.212 (if black) × 0.742 (if female). In addition, eGFR was also estimated from the CKD-EPI equation (8) as follows: eGFR = 141 × min(serum creatinine/κ, 1)α × max(serum creatinine/κ, 1)−1.209 × 0.993age × 1.018 (if female) × 1.159 (if black), where κ is 0.7 for females and 0.9 for males, α is −0.329 for females and −0.411 for males, min is the minimum of serum creatinine/κ or 1, and max is the maximum of serum creatinine/κ or 1. Urinary albumin excretion was measured from an early-morning urine sample on at least two consecutive occasions as the albumin-to-creatinine ratio (ACR) by an immunonephelometric method. Microalbuminuria was defined as an ACR 30–299 mg/g creatinine and macroalbuminuria as an ACR ≥300 mg/g creatinine (6,16).
Mortality follow-up
Vital status on 30 September 2007 was ascertained for all participants by examining the electronic databases of the Social Health Unit of the Veneto Region, which include all records of deaths occurring within the Veneto Region as well as the specific causes of death (13,17). Causes of death were identified in 100% of subjects. Death certificates were coded by trained nosologists using the ICD-9. Deaths were attributed to CVD causes when ICD-9 codes were 390–459. A selected sample of death certificates was reviewed manually to validate the process (13,17).
Statistical analysis
Data are presented as means ± SD, medians (interquartile range) (for non–normally distributed variables), or percentages. The distribution of eGFR classes and CKD stages was computed for GFR estimated using the MDRD study equation and the CKD-EPI equation, respectively. Subjects were classified as having CKD when their GFR values were <60 mL/min/1.73 m2 (6,15).
Univariate survival analysis stratified by CKD status for each GFR-estimating equation was performed by Kaplan-Meier analysis, and the overall significance was calculated by the log-rank test. Cox regression analysis was used to study the association between eGFR by each GFR-estimating equation and the risk of all-cause and CVD mortality after adjustment for potential confounders. In these analyses, eGFR was included as either continuous (for every 10 mL/min/1.73 m2 decrement in eGFR) or dichotomous (<60 vs. ≥60 mL/min/1.73 m2) variable. Three forced-entry Cox regression models were used: an unadjusted model, a model adjusted for age and sex (model 1), and a model adjusted for age, sex, BMI, diabetes duration, smoking, A1C, LDL cholesterol, hypertension, and current use of hypoglycemic or lipid-lowering agents (model 2). These covariates were chosen as potential confounding factors on the basis of their significance in univariate analyses or on the basis of their biological plausibility. The results were not also adjusted for race, since all participants were Caucasian. Results of Cox proportional hazards models are presented as hazard ratios (HRs) with 95% CI.
We compared the accuracy of the MDRD study equation and the CKD-EPI equation in predicting all-cause and CVD mortality using a receiver operating characteristic (ROC) curve analysis. In this analysis, eGFR by each equation was included as either continuous or dichotomous variable. The sensitivity, the specificity, and the area under the curve (AUC) were calculated for each GFR-estimating equation; the AUCs of the two equations were compared according to the procedure described by DeLong et al. (18). When we compared the accuracy of the two GFR-estimating equations in predicting CVD mortality, patients who died of noncardiovascular causes were excluded from ROC analysis. Statistical analysis was performed with statistical package SPSS 19.0. All tests were two sided. P values <0.05 were considered statistically significant.
RESULTS
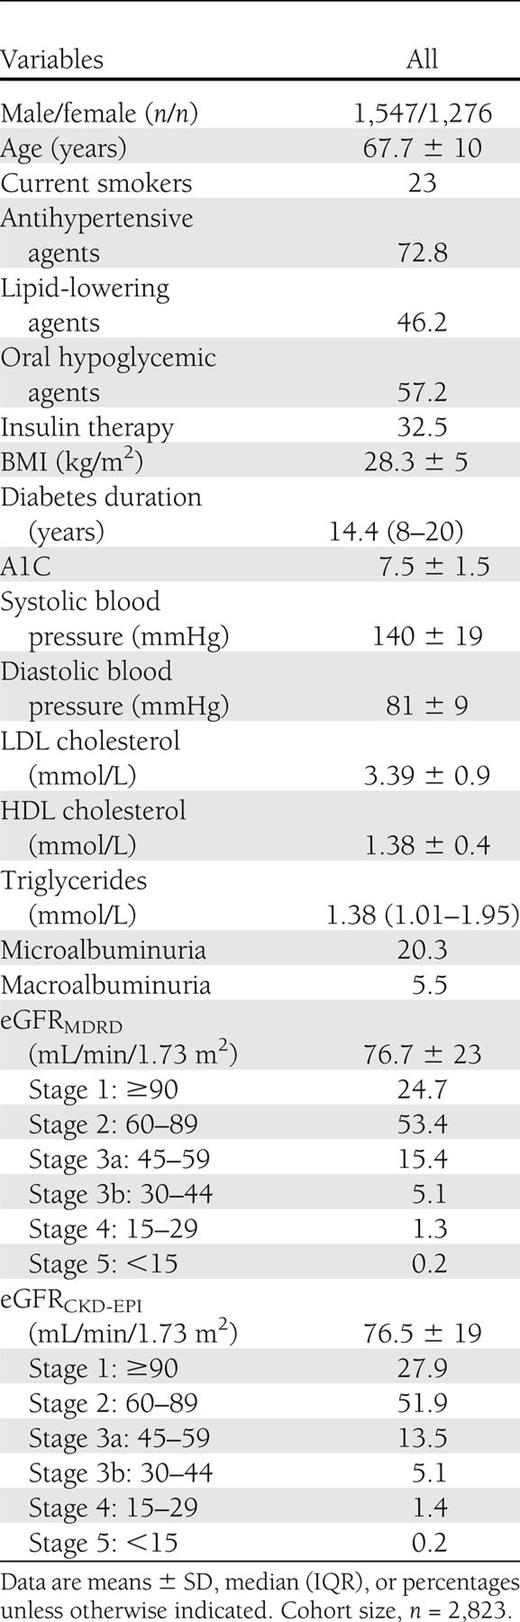
The baseline characteristics of 2,823 participants are displayed in Table 1. Mean values of age, A1C, and duration of diabetes were 67.7 years (range 33–94), 7.5% (5.1–19.4), and 15.5 years (1–57), respectively. CKD, defined as an eGFR level <60 mL/min/1.73 m2, was present in 22.0% (n = 621) and 20.2% (n = 570) of the whole sample using the MDRD study equation and the CKD-EPI equation, respectively. Among those with CKD by each equation, very few participants had an eGFR level <30 mL/min/1.73 m2 (i.e., CKD stage 4 or 5). Approximately 20% of the 2,823 participants had microalbuminuria, and 5.5% had macroalbuminuria.
We compared the MDRD study equation and the CKD-EPI equation using the concordance correlation and the Bland-Altman plot analysis. As shown in Supplementary Fig. 1, there was a good correlation between the two GFR-estimating equations (concordance correlation coefficient 0.92 [95% CI 0.91–0.93]; P < 0.0001); in the Bland-Altman plot the mean of differences between the two equations was −0.6 mL/min/1.73 m2 with 95% CI of the differences ranging from –16.1 to 15.0.
A total of 309 (cumulative incidence rate of 11%) subjects died during the follow-up. A total of 152 (5.4%) subjects died of CVD causes. The Kaplan-Meier survival analysis (Fig. 1) shows that patients with CKD by each GFR-estimating equation exhibited higher rates of all-cause and CVD mortality than those with an eGFR level ≥60 mL/min/1.73 m2. The differences among these curves were all statistically significant (P < 0.0001 by the log-rank test). Overall, among patients with CKD, the CKD-EPI equation identified a greater number of events than the MDRD study equation (124 vs. 120 deaths from all causes; 76 vs. 72 deaths from CVD causes). When we further stratified patients with CKD by quartiles of decreasing eGFR, there was a stepwise increase in the risk of both all-cause and CVD mortality across eGFR quartiles that was more pronounced among those in the lowest eGFR quartile (i.e., ≤44 mL/min/1.73 m2 for both equations) (P < 0.0001 by the log-rank test) (data not shown).

Kaplan-Meier survival analysis for all-cause and CVD mortality in 2,823 type 2 diabetic patients stratified by CKD according to each creatinine-based equation. The overall statistical significance was estimated by the log-rank test (P < 0.0001 for all).
Kaplan-Meier survival analysis for all-cause and CVD mortality in 2,823 type 2 diabetic patients stratified by CKD according to each creatinine-based equation. The overall statistical significance was estimated by the log-rank test (P < 0.0001 for all).
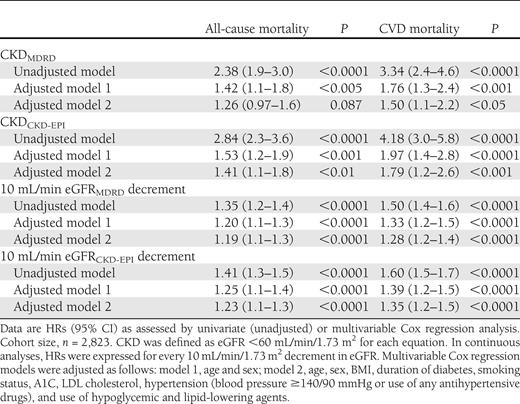
In Cox unadjusted regression analyses, as summarized in Table 2, CKD by each equation was associated with an increased risk of all-cause and CVD mortality. Almost identical results were observed when we examined the continuous association between eGFR (expressed for every 10 mL/min/1.73 m2 decrement in eGFR) and mortality rates. As shown in Table 2, the association of decreased eGFRCKD-EPI or eGFRMDRD with the risk of mortality remained statistically significant after adjustment for age and sex (model 1) and also after additional adjustment for BMI, diabetes duration, smoking, A1C, LDL cholesterol, hypertension, and medication use (model 2). Results did not change after additional adjustment for abnormal albuminuria (data not shown). In all of these Cox regression models, the magnitude of the associations was generally stronger for eGFRCKD-EPI (both as continuous and dichotomous variable) than for eGFRMDRD. Notably, other independent predictors of both all-cause and CVD mortality in fully adjusted regression models (model 2), together with either eGFRCKD-EPI or eGFRMDRD, were older age (P < 0.0001), male sex (P < 0.0001), longer duration of diabetes (P < 0.005), and higher A1C (P < 0.01).
Associations of decreased eGFR (included as either dichotomous or continuous variable) by each GFR-estimating equation with the risk of all-cause and CVD mortality in the whole sample of participants
We performed an ROC analysis in order to compare the accuracy of the two GFR-estimating equations in predicting all-cause and CVD mortality (Fig. 2). Overall, the CKD-EPI equation provided a more accurate risk prediction of both all-cause and CVD mortality than the MDRD study equation. In fact, the AUCs for all-cause mortality (AUC 0.712 [95% CI 0.682–0.741]) and CVD mortality (0.771 [0.734–0.808]) using eGFRCKD-EPI as a continuous variable were significantly greater (P < 0.0001 by the z statistic) than those obtained by using eGFRMDRD (0.679 [0.647–0.711] for all-cause mortality and 0.739 [0.698–0.783] for CVD mortality, respectively). At a clinical cutoff of eGFR <60 mL/min/1.73 m2, the sensitivity and specificity in predicting all-cause mortality were 38 and 80% for eGFRMDRD and 40 and 82% for eGFRCKD-EPI, respectively. The sensitivity and specificity in predicting CVD mortality, at the same eGFR cutoff, were 47 and 80% for eGFRMDRD and 50 and 82% for eGFRCKD-EPI, respectively.

ROC analysis for all-cause (left panel) and CVD (right panel) mortality for the MDRD study equation (dotted line) and the CKD-EPI equation (black line) in 2,823 type 2 diabetic patients.
ROC analysis for all-cause (left panel) and CVD (right panel) mortality for the MDRD study equation (dotted line) and the CKD-EPI equation (black line) in 2,823 type 2 diabetic patients.
Interestingly, the CKD-EPI equation provided a more accurate risk prediction of all-cause and CVD mortality than the MDRD study equation both in the short-term (e.g., 1st, 2nd, and 3rd years) and in the long-term period of follow-up. After 3 years of follow-up, the AUCs for all-cause mortality (AUC 0.720 [95% CI 0.691–0.750]) and CVD mortality (0.767 [0.736–0.798]) using eGFRCKD-EPI were greater (P < 0.001 by the z statistic) than those obtained by using eGFRMDRD (0.693 [0.662–0.724] for all-cause mortality and 0.737 [0.703–0.771] for CVD mortality, respectively).
CONCLUSIONS
To our knowledge, this prospective, observational study is the first to specifically compare the performance of the MDRD study equation and the CKD-EPI equation in predicting all-cause and CVD mortality in a large sample of type 2 diabetic individuals. Our findings show that decreased GFR as estimated by each equation was associated with an increased risk of all-cause and CVD mortality, independently of traditional CVD risk factors and other potential confounders. However, the strength of these associations appeared to be stronger for eGFRCKD-EPI than for eGFRMDRD. More interestingly, our findings show that the estimation of eGFR using the CKD-EPI equation more appropriately stratified the patients according to the risk of all-cause and CVD mortality compared with the MDRD study equation.
Collectively, the results of this study are in general agreement with our recent cross-sectional findings from the Renal Insufficiency And Cardiovascular Events (RIACE) Italian multicenter study showing that the CKD-EPI equation provided a better definition of global CVD burden—in terms of both CVD prevalence and 10-year coronary heart disease risk score—associated with CKD in ∼16,000 type 2 diabetic patients compared with the MDRD study equation (14). More interestingly, our results complement and expand recent prospective observations on the improved performance of the CKD-EPI equation for classification of long-term adverse outcomes in the general adult population (9–11). For instance, in the Atherosclerosis Risk in Communities (ARIC) study involving 13,905 middle-aged men and women (1.6% of whom having CKD), it was found that the CKD-EPI equation more appropriately classified individuals with respect to the risk of end-stage renal disease and CVD morbidity and mortality as compared with the MDRD study equation (9). Similarly, the CKD-EPI equation more appropriately stratified the subjects according to the risk of CVD events and death in two other large population-based cohort studies (10,11). More recently, in a post hoc analysis of the Valsartan in Acute Myocardial Infarction (VALIANT) Trial, it was confirmed that the CKD-EPI equation provided more accurate risk prediction for adverse CVD outcomes than the MDRD study equation in a highly selected group of patients who had acute myocardial infarction complicated by heart failure or left ventricular systolic dysfunction (19).
To date, the CKD-EPI equation is considered the most accurate method for estimating GFR for diverse populations (1,8,19). Most studies have confirmed the increased accuracy of the CKD-EPI equation versus the MDRD study equation when compared with measured GFR, and most but not all studies (9,20,21) have confirmed the (slightly) lower prevalence of CKD. However, more research is required to confirm the increased accuracy and precision of the CKD-EPI equation compared with the MDRD study equation in estimating GFR in elderly people in different ethnic populations and in patients with type 2 diabetes (8,20). Due to the lack of direct GFR measures, our study was not designed to evaluate whether the CKD-EPI equation performs better than the MDRD study equation in estimating GFR among type 2 diabetic patients. The CKD-EPI equation does not overcome the limitations of serum creatinine as an endogenous filtration marker (7,8,20). All creatinine-based equations should be used with caution in people with abnormally high or low muscle mass (1,2,6,7,20). Nevertheless, serum creatinine concentration is currently central for the clinical assessment of kidney function, and GFR estimates based on serum creatinine will continue to be used in clinical practice for the foreseeable future (1,2,6,7,20).
Our findings may have some important clinical implications. Overall, the evidence from this and other large prospective studies suggests that the CKD-EPI equation permits a more accurate risk prediction for mortality and other adverse clinical outcomes both in the general population (9–11) and in at-high risk populations (18), thus further reinforcing the recommendation from the CKD-EPI investigators that the CKD-EPI equation could replace the MDRD study equation for general use (8). These investigators have demonstrated that the CKD-EPI equation is somewhat more precise and accurate than the MDRD study equation in predicting measured GFR across various study populations and clinical conditions (8). Bias is improved, especially at higher eGFR values, although precision of the CKD-EPI equation remains suboptimal (8). Although the CKD-EPI equation is more complex than the MDRD study equation, it could readily be incorporated into clinical laboratory information systems by using the same input variables required for the MDRD study equation. The use of the CKD-EPI equation does not involve any invasive risk to the patients and would not result in any additional health cost. Accordingly, even small improvements in risk prediction of mortality and other clinical outcomes using the CKD-EPI equation might result in important public health gains.
Our study has some important limitations. First, because our cohort comprised white European individuals with type 2 diabetes, who were followed at an outpatient diabetes clinic, our results may not necessarily be generalizable to other nonwhite diabetic populations. Second, since most of our patients with CKD had moderately reduced eGFR values (CKD stage 3), it remains to be demonstrated whether these results can also be extrapolated to patients with more severe stages of CKD. Finally, we did not test the accuracy of the two GFR-estimating equations against a directly measured GFR (e.g., isotopic GFR measurements).
Notwithstanding these limitations, our study has important strengths, including its prospective, observational design, the large sample size, the complete nature of the dataset, the relatively large number of events during the follow-up, and the ability to adjust for multiple risk factors and important confounders.
In conclusion, our findings indicate that the CKD-EPI equation may provide a more accurate risk prediction of all-cause and CVD mortality than the MDRD study equation in patients with type 2 diabetes. Further prospective studies in larger cohorts of type 2 diabetic patients with different stages of CKD are needed to confirm the reproducibility of our results and to examine whether the more precise estimation of GFR with combined equations based on serum creatinine, cystatin C, or other filtration markers will provide better risk predictions of mortality and other adverse clinical outcomes (22–24).
Acknowledgments
No potential conflicts of interest relevant to this article were reported.
G.T. researched data, analyzed data, and wrote the manuscript. G.Z. researched data, contributed to discussion, and reviewed and edited the manuscript. W.M. analyzed data, contributed to discussion, and reviewed and edited the manuscript. M.C. contributed to discussion and reviewed and edited the manuscript. C.N., V.S., A.M., and F.D.S. researched data and reviewed and edited the manuscript. E.B. contributed to discussion, and reviewed and edited the manuscript. G.T. is the guarantor of this work and, as such, had full access to all the data in the study and takes responsibility for the integrity of the data and the accuracy of the data analysis.
