


Although carbohydrate counting is routine practice in type 1 diabetes, hyperglycemic episodes are common. A food insulin index (FII) has been developed and validated for predicting the normal insulin demand generated by mixed meals in healthy adults. We sought to compare a novel algorithm on the basis of the FII for estimating mealtime insulin dose with carbohydrate counting in adults with type 1 diabetes.
A total of 28 patients using insulin pump therapy consumed two different breakfast meals of equal energy, glycemic index, fiber, and calculated insulin demand (both FII = 60) but approximately twofold difference in carbohydrate content, in random order on three consecutive mornings. On one occasion, a carbohydrate-counting algorithm was applied to meal A (75 g carbohydrate) for determining bolus insulin dose. On the other two occasions, carbohydrate counting (about half the insulin dose as meal A) and the FII algorithm (same dose as meal A) were applied to meal B (41 g carbohydrate). A real-time continuous glucose monitor was used to assess 3-h postprandial glycemia.
Compared with carbohydrate counting, the FII algorithm significantly decreased glucose incremental area under the curve over 3 h (–52%, P = 0.013) and peak glucose excursion (–41%, P = 0.01) and improved the percentage of time within the normal blood glucose range (4–10 mmol/L) (31%, P = 0.001). There was no significant difference in the occurrence of hypoglycemia.
An insulin algorithm based on physiological insulin demand evoked by foods in healthy subjects may be a useful tool for estimating mealtime insulin dose in patients with type 1 diabetes.
In type 1 diabetes management, premeal insulin dosage and physiological insulin requirement must be matched to optimize postprandial blood glucose profiles (1,2). Currently, carbohydrate counting is considered the “gold standard” for estimation of meal-time insulin dose (3). Carbohydrate counting assumes that only carbohydrates influence the dose of insulin required and that equal portions of carbohydrate produce a similar glycemic response and require the same amount of exogenous insulin to be metabolized. However, even when glycated hemoglobin levels fall within the ideal range, many individuals continue to experience unanticipated hyperglycemic and hypoglycemic events that increase the risk for development of complications and reduce quality of life (4,5). Since mealtime insulin dose is a major determinant of postprandial glycemic control, improving the insulin algorithm is a significant clinical issue. Our novel strategy for insulin dosing is based on the hypothesis that exogenous insulin requirements can be more precisely predicted by knowledge of the physiological insulin response evoked by normal healthy subjects consuming iso-energetic portions of common foods.
In the lead-up to this research, our group developed a food insulin index (FII) for ranking relative dietary insulin demand generated by 1,000-kJ portions of single foods consumed by healthy subjects (6). By using food energy as the constant, the concept takes into account not just carbohydrate, but all the dietary factors and their interactions that influence insulin demand. Currently, the FII database contains >120 single foods covering the primary sources of energy in western diets. In recent studies (7) (J.B., F. Atkinson, J.C.B.-M., unpublished data) in healthy subjects, we confirmed that the insulin demand evoked by mixed meals (single meals and consecutive meals) was more strongly predicted by the FII of the component foods than by the carbohydrate, fat, protein, fiber content, or glycemic load (glycemic load = carbohydrate content per serving × glycemic index %) of the meal.
Newer intensive regimens using insulin pumps have been shown to improve postprandial glycemia (8); however, bolus insulin delivery on the basis of carbohydrate counting is difficult or inefficient for some patients (9,10). In our clinical experience, many patients report unexpected hyperglycemic episodes despite strict adherence to carbohydrate counting, particularly for meals that are high in protein and/or fat. The potential additional benefits (if any) of using the novel FII algorithm instead of carbohydrate counting in the control of postprandial glycemia are not known. This study (Normal Insulin Demand for Dose Adjustment [NIDDA]) aimed to compare the FII algorithm versus conventional carbohydrate counting for estimating the mealtime insulin dose required for different breakfast meals of varying macronutrient composition. Our hypothesis was that use of the FII algorithm would reduce the magnitude of fluctuations in blood glucose levels after meals, without increasing hypoglycemia, in comparison with the habitual carbohydrate-counting algorithm.
RESEARCH DESIGN AND METHODS
We recruited adults with type 1 diabetes on insulin pump therapy from the patient population attending the Sydney insulin pump clinic. Eligibility criteria included the following: aged between 18 and 70 years inclusive; type 1 diabetes diagnosed for ≥1 year; use of insulin pump therapy, including proficiency with use of a bolus dose calculator for ≥2 months; and HbA1c ≤9.0% and reliably performing self-monitoring of blood glucose at least four times daily. Exclusion criteria included eating disorders and individuals using medication that may influence blood glucose. The protocol was approved by the Human Research Ethics Committee of the University of Sydney, and subjects gave informed consent.
Study design
The participant recruitment started 1 month before the commencement of testing. Patients were instructed by the credentialed diabetes educator (CDE) to perform routine self-monitoring of blood glucose during the run-in period to verify individual basal rates and insulin to carbohydrate ratio (ICR). One week before testing, the diabetes team at the Sydney Insulin Pump Clinic (CDE and clinical dietitian) conducted small group meetings (n = 2∼3 patients) to discuss detailed requirements of the study, assess carbohydrate counting skills, and review bolus-wizard settings on the basis of self-monitoring of blood glucose data and sophisticated online diabetes management software (Medtronic Diabetes CareLink Personal Therapy Management Software). The purpose of the meeting was to optimize fasting blood glucose levels and fine-tune ICR and basal rates. The patients were instructed to make every effort to eliminate confounding variables that may otherwise affect blood glucose variation, including avoiding unusual exercise and alcohol intake during the 4-day study period.
The study was carried out under supervision in a dedicated research room. During the test week, participants were required to attend the testing room on 4 half-days (Monday to Thursday). On Monday afternoon, the real-time continuous glucose monitoring system (CGMS) device (MiniMed Paradigm, Medtronic, Northridge, CA) was inserted and calibrated for each attended subject. Subjects were instructed to enter four finger-prick blood glucose levels per day into the monitor at a time when blood glucose levels were stable for calibration (i.e., time before meal or before bed). Standardized dinner meals with precise amounts and same type of carbohydrate were distributed to standardize the impact of the evening meals on morning glycemia. Measuring cups and a kitchen scale were supplied to facilitate adjustment of meal size and amount of carbohydrate. On Tuesday, Wednesday, and Thursday mornings, subjects attended the clinic in the fasted state and consumed the test breakfasts with pre-assigned insulin algorithms (Supplementary Fig. 1). The order of three test meal–bolus algorithm combinations was randomized using a random digit table.
Each participant consumed two different breakfast meals (meals A and B), devised to have equal energy and fiber content, glycemic index (GI), and calculated insulin demand on the basis of the weighted FII of the component foods, but meal A was designed to have double the carbohydrate content of meal B (Table 1). Meal A was consumed only once, with insulin dosing according to the subject’s usual ICR, as verified during the run-in week. Meal B was consumed on two occasions (B1 and B2): once using carbohydrate counting as the basis for the insulin dose (about half the dose of insulin used in meal A) and once using the FII algorithm (the same dose as meal A, since both meals have the same insulin demand [FII = 60]). In the context of the current study design, insulin dosing for meal A was identical whether based on carbohydrate counting or the FII algorithm (Supplementary Fig. 2). The test meals were prepared on the testing day before subjects arrived, and the component foods were weighed using a Tanita kitchen scale (model KD-160; Tanita Corporation, Arlington Heights, IL) (2 kg max/1 g resolution). All the component foods were prepared according to the same procedure used for testing the original FII values (11).
Nutritional composition, GI, and FII of the component foods in two different breakfast meals (meal A and meal B)
| Weight (g) | Energy (kJ [kcal]) | AvCHO* (g) | GI (%) | Fiber (g) | FII (%) | Protein (g) | Fat (g) | |
|---|---|---|---|---|---|---|---|---|
| Meal A ingredients | ||||||||
| Grain bread (Burgen, Soy-Lin, Chatswood, Australia) | 57 | 580 (139) | 17 | 36 | 4 | 52 | 9 | 3 |
| Raspberry jam (Cottees, Southbank, Australia) | 23 | 265 (63) | 16 | 51 | 0 | 62 | 0 | 0 |
| Peach, canned in syrup (SPC, Ardmona, Australia)† | 261 | 755 (181) | 42 | 58 | 2 | 65 | 1 | 3 |
| Total | 342 | 1,600 (383) | 75 | 52 | 6 | 60 | 10 | 6 |
| Meal B ingredients | ||||||||
| Croissant (Woolworth Supermarket, Sydney, Australia) | 55 | 835 (200) | 24 | 67 | 2 | 58 | 5 | 9 |
| Yogurt, low-fat strawberry (Dairy Farmers, Lidcombe, Australia) | 120 | 460 (110) | 17 | 31 | 1 | 84 | 6 | 2 |
| Egg (boiled) | 50 | 305 (73) | 0 | 0 | 0 | 23 | 6 | 6 |
| Total | 225 | 1,600 (383) | 41 | 53 | 3 | 59 | 17 | 17 |
*AvCHO, available carbohydrate including sugars and starch and excluding fiber.
†104 g syrup and 157 g peaches.
On each test day, participants arrived at the testing room 0800 h after a minimum 10-h overnight fast. Fasting blood glucose level was recorded. Rapid-acting insulin was administered immediately before meal consumption. Subjects consumed the test meal within 20 min and remained sedentary throughout the session. No additional food or drink (except water) was consumed during the 3-h postprandial period unless required to treat symptomatic hypoglycemia. Blood glucose levels were monitored using the real-time CGMS and finger-prick blood testing with a blood glucose monitor (HemoCue; HemoCue Limited, Angelhom, Sweden) at 0.5-h intervals over the 3-h test period. At the conclusion of the test (Thursday at noon), CGMS data were downloaded for analysis. The CDE and clinical dietitian monitored the patients throughout the test sessions, and hypoglycemia was treated and recorded if it occurred. On any given morning, if the preprandial blood glucose level was >13 or <4 mmol/L, the subject was treated and asked to return for an additional test day the following week.
Statistical analysis
A sample size of 31 patients provided 80% power to detect a difference in glucose incremental area under the curve (iAUC) of ∼220 mmol × min/L between carbohydrate counting and the FII algorithm at the 5% significance level, assuming a within-person SD of differences in iAUC of ∼400 mmol × min/L. The blood glucose profile during the 3-h postprandial period was analyzed using the SPSS statistical package (version 19.0; SPSS, Chicago, IL). A one-way repeated-measures ANOVA was used to analyze the following parameters between the comparable test conditions: 1) time within normal blood glucose level range (4.0∼10.0 mmol/L), 2) the iAUC as described previously (12), 3) peak blood glucose level excursion, 4) fasting blood glucose level, 5) time to peak blood glucose level, and 6) time to return to fasting blood glucose level. For significant variables, post hoc test comparisons of means were carried out using least significant differences without any adjustment for multiple comparisons. Differences in coefficients were considered statistically significant if P was < 0.05 and highly significant if P was < 0.01 (two-tailed). Cochran Q test was used to assess the differences in numbers of hypoglycemia episodes (defined as blood glucose level ≤3.9 mmol/L) between carbohydrate counting and the FII algorithm. Data following treated hypoglycemic episodes were excluded from analysis. Results are presented as means ± SD unless otherwise stated.
RESULTS
A total of 31 adults with type 1 diabetes on insulin pump therapy participated in the study. One participant failed to finish the three test sessions because of food intolerance. One participant had an inappropriate starting blood glucose level on the first test day and was not available to repeat this test session. One participant missed CGMS-derived blood glucose level data in one test session because of equipment failure. The results of 28 participants (11 men, 17 women) were available for analysis.
The mean age of participants was 37.8 ± 14.4 (range 21–62) years. The subjects had been diagnosed with type 1 diabetes for 19.6 ± 11.4 years and had been on insulin pump therapy for 2.7 ± 2.3 years. The mean HbA1c was 7.8 ± 0.9%. The preprandial blood glucose level for each of the three test conditions was not significantly different (P = 0.41) (Table 2).
Mean results of fasting blood glucose, time within normal range of blood glucose, peak blood glucose excursion, 3-h glucose iAUC, time to peak, and fasting blood glucose level for each testing condition
| Test conditions | Fasting blood glucose level (mmol/L) | Time within blood glucose level normal range (4 – 10 mmol/L) (min) | Glucose 3-h iAUC (mmol × min/L) | Peak blood glucose excursion (mmol/L) | Time to peak blood glucose level (min) | Time to fasting blood glucose level (min) |
|---|---|---|---|---|---|---|
| Meal B (the novel FIIalgorithm) | 8.3 ± 2.8 | 128 ± 57 | 197 ± 220 | 2.4 ± 1.9 | 59 ± 28 | 118 ± 55 |
| Meal B (carbohydrate counting) | 8.1 ± 2.7 | 88 ± 69* | 409 ± 373† | 4.1 ± 3.1† | 97 ± 56† | 158 ± 41* |
| Meal A (carbohydrate counting) | 7.5 ± 2.2 | 108 ± 46 | 275 ± 224 | 4.0 ± 2.8† | 59 ± 27 | 118 ± 52 |
| One-way repeated-measures ANOVA (P) | 0.41 | 0.025 | 0.015 | 0.009 | 0.001 | 0.001 |
Data are means ± SD. n = 28 adults with type 1 diabetes. Data after treated hypoglycemic episodes did not form part of the analysis. Post hoc comparisons for significant variables used least significant differences.
*Highly significantly different (P < 0.01) when compared with result for meal B using the novel insulin dose algorithm.
†Statistically different (P < 0.05).
Time within the normal blood glucose level range (4.0–10.0 mmol/L) in the 3-h postprandial period after consuming meals is shown in Table 2. Compared with carbohydrate counting, the FII algorithm significantly improved the time within the optimal blood glucose level range by 31% (88 ± 69 vs. 128 ± 57 min, P = 0.001, n = 28). There was no significant difference in the percent time within normal range between meal A with carbohydrate counting and meal B using the FII algorithm (108 ± 46 vs. 128 ± 57 min, P = 0.20, n = 28) (Fig. 1).
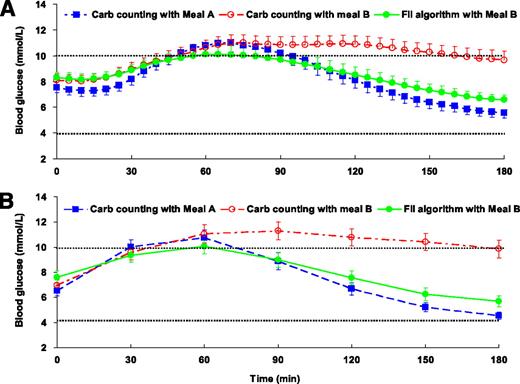
A: Continuous glucose monitoring data of mean 3-h postprandial blood glucose (± SEM) in 28 adults with type 1 diabetes on insulin pump therapy. Any readings between 4.0 and 10.0 mmol/L were reported as within the optimal blood glucose range. B: HemoCue blood glucose meter data of mean 3-h postprandial blood glucose (± SEM) in 28 adults with type 1 diabetes on insulin pump therapy. A one-way repeated-measures ANOVA was conducted to assess differences between test conditions on each outcome parameter. P < 0.05, statistically significant, and P < 0.01, highly significant. Data after treated hypoglycemic episodes were excluded from analysis. Carb, carbohydrate.
A: Continuous glucose monitoring data of mean 3-h postprandial blood glucose (± SEM) in 28 adults with type 1 diabetes on insulin pump therapy. Any readings between 4.0 and 10.0 mmol/L were reported as within the optimal blood glucose range. B: HemoCue blood glucose meter data of mean 3-h postprandial blood glucose (± SEM) in 28 adults with type 1 diabetes on insulin pump therapy. A one-way repeated-measures ANOVA was conducted to assess differences between test conditions on each outcome parameter. P < 0.05, statistically significant, and P < 0.01, highly significant. Data after treated hypoglycemic episodes were excluded from analysis. Carb, carbohydrate.
Using the FII algorithm resulted in a 52% decrease in iAUC compared with carbohydrate counting after the same meal B (197 ± 220 vs. 409 ± 373 mmol × min/L, P = 0.013, n = 28) (Table 2). iAUC was also calculated using the data derived from the HemoCue blood glucose meters. The FII algorithm elicited a 58% reduction in iAUC (P < 0.001, n = 28) (Fig. 1).
The FII algorithm also produced a 1.7 mmol/L lower (41% decrease) peak blood glucose excursion compared with the carbohydrate-counting algorithm (2.4 ± 1.9 vs. 4.1 ± 3.1 mmol/L, P = 0.01, n = 28). The mean time to peak blood glucose excursion for the FII algorithm occurred at 59 min, which was significantly earlier than that for carbohydrate counting (at 97 min) (P = 0.002). In contrast, as predicted, there was no difference in time to peak blood glucose level between the FII algorithm after the consumption of meal B and carbohydrate counting with meal A (P = 0.86), although the mean peak blood glucose level excursion for meal B using the FII algorithm was significantly lower (2.4 ± 1.9 vs. 4.0 ± 2.8 mmol/L, P = 0.012, n = 28) (Table 2).
Mean time taken to return to fasting blood glucose level was significantly longer for carbohydrate counting in meal B relative to the FII algorithm (158 ± 41 vs. 118 ± 55 min, P < 0.001, n = 28). The majority of participants (61%) using carbohydrate counting for meal B failed to return to fasting blood glucose level at the 3-h time point compared with only 21% of participants using the FII algorithm. There was no significant difference in time to reach fasting blood glucose level between meal B with the FII algorithm and meal A with carbohydrate counting (P = 0.99) (Table 2).
No severe hypoglycemia episodes were observed. For the total 84 test occasions, 17 mild hypoglycemic episodes that required treatment were recorded, and 4% of data time was excluded from analysis because of hypoglycemia treatment during the 3-h postprandial period. Hypoglycemia was reported in all three test conditions, and most (12 of 17) occurred at the tail end of the monitoring period (150∼180 min). Ten episodes occurred after meal A using carbohydrate counting, six episodes followed meal B with the FII algorithm, and one episode followed meal B with carbohydrate counting. The differences between rates under carbohydrate counting and the FII algorithm were not significant in either case (FII algorithm/meal B vs. carbohydrate counting/meal A: P = 0.57; FII algorithm/meal B vs. carbohydrate counting/meal B: P = 0.31).
CONCLUSIONS
The current study demonstrates that a novel FII algorithm derived from insulin responses in healthy individuals improved acute postprandial glycemia compared with the use of carbohydrate counting in subjects with well-controlled type 1 diabetes using intensive insulin pump therapy. The FII algorithm improved time spent in the postprandial normoglycemic range, produced a significantly lower iAUC and a smaller peak blood glucose excursion, and reduced the time to reestablish the fasting blood glucose level. Taken together, the findings provide the first stage of clinical evidence that use of a FII based on relative insulin demand in healthy subjects may be an effective tool for estimating mealtime insulin dose in type 1 diabetes.
Matching insulin to the carbohydrate amount of a meal is a proven strategy in achieving glycemic control (13). Nonetheless, numerous studies have shown that other dietary factors, including GI, protein or certain insulinotropic amino acids, fat, and fiber content, also affect the degree of postprandial insulinemia in both healthy and type 2 diabetic subjects (7,14–17). Moreover, these factors significantly affect mealtime insulin required in type 1 diabetes (18,19). Although carbohydrate counting is universally promoted in routine practice, many individuals with type 1 diabetes continue to report elevated postprandial blood glucose levels and remain at high levels for 2 or 3 h, particularly after the ingestion of meals with higher protein and/or fat content, such as pizza (19,20) and other fast foods (9). Epidemiological evidence has shown that elevated postprandial glucose increases the risk of cardiovascular disease, atherosclerosis, and mortality (21,22). It is therefore clinically important that in the context of everyday life, other dietary factors that influence insulin secretion should be considered.
Theoretically, use of carbohydrate counting may better suit meals with high carbohydrate content and less protein and fat. Meal A was designed to contain 75 g carbohydrate with only 20% of energy derived from protein and fat. The bolus-wizard settings and ICR of all participants were verified during the run-in period before testing. Blood glucose data after meal A was therefore the “reference” meal in the current study. Meal B was designed specifically to have approximately half the carbohydrate content of meal A but the same insulin demand based on knowledge of the FII values of the component foods. The FII algorithm was compared with carbohydrate counting after the consumption of meal B. As predicted, the mean blood glucose profile obtained using the FII algorithm closely mirrored the glucose profile of meal A. In contrast, the carbohydrate-counting algorithm produced very different glucose profiles (Fig. 1). This evidence supports our hypothesis that meals with the same insulin demand (assessed by FII = 60) should be administered the same dose of insulin. Nevertheless, meal A showed a significantly higher peak blood glucose excursion than meal B with the novel FII algorithm, which was not hypothesized. The result may reflect differences in the action of exogenous versus endogenous insulin on meals with a high glycemic load (glycemic load of meal A was twofold higher than that of meal B). Injected insulin must be absorbed and transported to the site of action and may therefore not act as promptly as endogenous insulin does in a healthy subject consuming a high–glycemic load meal. Several studies in type 1 diabetes have demonstrated that a high–glycemic load meal produces much higher blood glucose responses than a low–glycemic load meal with a standardized insulin-dosing algorithm (5,14,23).
Notably, the FII algorithm did not significantly increase the risk of occurrence of hypoglycemic episodes, although the total number of episodes appeared to be higher than in previous studies of this nature (14,23,24). The real-time CGMS device incorporated a low blood glucose level alarm system so that hypoglycemia was more likely to be identified than during routine management. The instant blood glucose level profiles shown on the CGMS screen made it difficult to blind the patients and study personnel. This situation is different from previous studies in which blood glucose profiles were only available at the end, and hypoglycemia was not treated unless the individual felt symptomatic (14,23). It is also possible that the standard bolus delivering 100% rapid-acting insulin immediately before the meal might not be suitable for low-GI meals such as meals A and B (both GI = ∼52). In a previous study, hypoglycemic episodes occurred two times more frequently with standard bolus compared with dual-wave bolus when low-GI meals were consumed (23).
Several limitations must be acknowledged. First, patients were not blinded to the real-time CGMS device. The instant readings of hyper- or hypoglycemia shown on the CGMS screen could induce symptomatic episodes, compromising the patient’s compliance with the study protocol. The FII algorithm was applied for a short period of time to a single meal, and the effects of daylong or chronic feeding on glycemic control remain to be explored. Dose-response relationships (i.e., insulin demand–to–insulin ratio) also need to be established before the FII algorithm can be put into routine clinical practice in the management of type 1 diabetes. Further clinical studies should clarify these important issues.
Currently, our database includes the FII of >120 common foods covering the most important energy sources in western diets (11). Other researchers therefore have the tools to undertake further clinical studies in this area to determine the practicality in using an insulin demand–to–insulin ratio to calculate mealtime insulin dose instead of a carbohydrate-to-insulin ratio. It can be argued that there is no additional burden integrating the FII algorithm into routine practice because FII counting replaces carbohydrate counting. In food tables, a new number (the insulin demand per serving) would replace the grams of carbohydrate per serving of a particular food. Of course, a major hurdle is the fact that a food’s FII does not currently appear on food labels, while carbohydrate does. We acknowledge that implementation of these findings represents advanced insulin therapy, which may best be incorporated when basic nutrition knowledge is established.
In summary, the NIDDA study supports further studies of a novel insulin algorithm on the basis of physiological insulin demand evoked by foods in healthy subjects as a tool for estimating mealtime insulin dose, resulting in improvement of postprandial glycemia. Given the fact that optimal postprandial control is classified as one of the most challenging aspects of type 1 diabetes management (25), continuing efforts for optimizing advanced insulin therapy to achieve physiological postprandial blood glucose profiles are warranted.
Clinical trial reg. no. ACTRN12609001034224, anzctr.org.
Acknowledgments
Support for this study was provided by the University of Sydney.
No potential conflicts of interest relevant to this article were reported.
J.B. conceived the study, interpreted data, conducted the study, prepared the meals, collected data, analyzed data, and wrote the manuscript. H.R.G. conceived the study and interpreted data. R.G. and D.M. conducted the study, prepared the meals, and collected data. G.H. monitored and supervised the whole test period as an endocrinologist. P.P. analyzed data. S.C. conceived the study. J.C.B.-M. conceived the study, interpreted data, and wrote the manuscript. All authors contributed to discussion of the manuscript.
Parts of this study were presented in abstract form and was awarded the Best Oral Presentation at the Australian Diabetes Society and Australia Diabetes Educators Association joint annual scientific meeting, Sydney, Australia, 1–3 September 2010.
This study has been presented at the 1st Asia Pacific Congress on Controversies to Consensus in Diabetes, Obesity and Hypertension (CODHy), Shanghai, China, 2–5 June 2011 and will be presented at 47th European Association for the Study of Diabetes (EASD) Annual Meeting, Portugal, Lisbon, 12–16 September 2011.
