


An International Expert Committee (IEC) and the American Diabetes Association (ADA) proposed diagnostic criteria for diabetes and pre-diabetes based on A1C levels. We hypothesized that screening for diabetes and pre-diabetes with A1C measurements would differ from using oral glucose tolerance tests (OGTT).
We compared pre-diabetes, dysglycemia (diabetes or pre-diabetes), and diabetes identified by the proposed criteria (A1C ≥6.5% for diabetes and 6.0–6.4% [IEC] or 5.7–6.4% [ADA] for high risk/pre-diabetes) with standard OGTT diagnoses in three datasets. Non-Hispanic white or black adults without known diabetes who had A1C and 75-g OGTT measurements were included from the prospective Screening for Impaired Glucose Tolerance study (n = 1,581), and from the National Health and Nutrition Examination Survey (NHANES) III (n = 2014), and NHANES 2005–2006 (n = 1,111).
OGTTs revealed pre-diabetes in 35.8% and diabetes in 5.2% of combined study subjects. A1C provided receiver operating characteristic (ROC) curve areas for diabetes of 0.79–0.83, but ROC curve areas were ≤0.70 for dysglycemia or pre-diabetes. The proposed criteria missed 70% of individuals with diabetes, 71–84% with dysglycemia, and 82–94% with pre-diabetes. Compared with the IEC criteria, the ADA criteria for pre-diabetes resulted in fewer false-negative and more false-positive result. There were also racial differences, with false-positive results being more common in black subjects and false-negative results being more common in white subjects. With use of NHANES 2005–2006 data, ∼5.9 million non-Hispanic U.S. adults with unrecognized diabetes and 43–52 million with pre-diabetes would be missed by screening with A1C.
The proposed A1C diagnostic criteria are insensitive and racially discrepant for screening, missing most Americans with undiagnosed diabetes and pre-diabetes.
Diabetes affects >21 million American adults (1,2), with a lifetime risk ranging from 20 to 50+%, depending on sex and race (3). Identification of diabetes and its precursor, pre-diabetes, can permit management to prevent complications or delay progression from pre-diabetes to diabetes. Because most U.S. health care systems do not have systematic screening programs, many Americans have undiagnosed diabetes and pre-diabetes, and, therefore, these individuals are not initiating programs targeted at prevention (2).
An International Expert Committee (IEC) recently proposed new diagnostic criteria based on measurement of A1C, with A1C ≥6.5% for diabetes and 6.0–6.4% for “high risk” of progression to diabetes (4). The American Diabetes Association (ADA) subsequently proposed A1C ≥6.5% for the diagnosis of diabetes and 5.7–6.4% for the highest risk to progress to diabetes (5).
Because A1C testing is readily available in the U.S., is relatively well standardized, exhibits low intraindividual variation, and does not require fasting or restriction to certain times of the day (6), many clinicians might wish to use A1C measurements to screen for diabetes and pre-diabetes. However, the proposed diagnostic criteria were based largely on identification of diabetic retinopathy, and use of the proposed criteria as a screening test is not understood. The IEC A1C criteria have recently been compared with testing with fasting glucose or oral glucose tolerance tests (OGTTs) in various populations to diagnose diabetes (7,,,,,–13) and high-risk/pre-diabetes (10,11,13), but the ADA A1C criteria have not been studied.
We hypothesized that A1C diagnostic criteria would fail to identify many subjects with unrecognized diabetes or pre-diabetes. We evaluated the proposed criteria as screening tests in three populations, compared with the OGTT as a “gold standard” used for identification of diabetes and pre-diabetes around the world (14).
RESEARCH DESIGN AND METHODS
We examined three datasets in which non-Hispanic white and black adult subjects without known diabetes had both an OGTT and A1C measured (15).
In the Screening for Impaired Glucose Tolerance (SIGT) study (16), health care system employees and community members in Atlanta were eligible if they were aged ≥18 or above, were non-Hispanic white or black race, had no prior diagnosis of diabetes, were not pregnant or breastfeeding, were not taking glucocorticoids, and were well enough to work. A total of 1,581 subjects completed the protocol.
The National Health and Nutrition Examination Surveys (NHANES) assessed adults and children across the U.S. In NHANES III (17), 2,057 non-Hispanic black or white subjects (to match the SIGT study population) aged >40 years with no known history of diabetes had an OGTT, meeting the inclusion criteria. In NHANES 2005–2006 (18), 1,154 non-Hispanic adult subjects aged ≥18 years met the inclusion criteria. Age, BMI, blood pressure, lipids, and family history were categorized using conventional criteria. After subjects with missing data were excluded, there were 2,014 subjects in NHANES III and 1,111 subjects in NHANES 2005–2006, as described previously (15).
Glucose and A1C measurements
Plasma glucose and A1C measurements have been described previously (16,–18). A1C measurements used NGSP–certified systems (supplementary material, available in an online appendix at http://care.diabetesjournals.org/cgi/content/full/dc10-0433/DC1).
Classification of glucose tolerance
Glucose tolerance was classified by ADA criteria on the basis of glucose levels in a single 75-g OGTT. Subjects were grouped as normal glucose tolerance (fasting plasma glucose [FPG] <100 mg/dl, with 2-h plasma glucose <140 mg/dl), pre-diabetes (impaired fasting glucose with FPG 100–125 mg/dl and 2-h plasma glucose <200 mg/dl and/or impaired glucose tolerance with FPG <126 mg/dl and 2-h plasma glucose 140–199 mg/dl), and diabetes (FPG ≥126 mg/dl or 2-h plasma glucose ≥200 mg/dl). The additional IEC criteria identified subjects as normal (A1C <6%), high risk for diabetes (A1C 6.0–6.4%), and diabetes (A1C ≥6.5%), whereas new ADA criteria identified subjects as normal (A1C <5.7%), high risk (A1C 5.7–6.4%), and diabetes (A1C ≥6.5%). Additional evaluations used FPG ≤110 mg/dl for normal glucose tolerance. “Dysglycemia” includes pre-diabetes or diabetes (OGTT) or high risk or diabetes (A1C).
Statistical analysis
Means and frequencies were determined in aggregate and by subgroup analysis of the different glucose tolerance categories. The discriminative effectiveness of screening was evaluated by the area under receiver operating characteristic (ROC) curves using SAS 9.2 (SAS Institute, Cary, NC) for the NHANES data and SPSS 15.0 (SPSS, Chicago, IL) for SIGT study data. All NHANES analyses were conducted using SAS 9.2 and SUDAAN version 10 (RTI International, Research Triangle Park, NC) to account for the complex survey design. Prevalence estimates from NHANES studies were weighted, except where noted or when small sample sizes made weighting estimates unstable; 95% CIs were calculated using the Wilson score method. Paired t tests compared rates of apparent false-positive and false-negative identification of diabetes or high risk in black and white subjects. Population estimates were derived from the results of the weighted NHANES 2005–2006 dataset and applied to non-Hispanic black or white adults for whom data were available (∼156 million individuals). No additional extrapolations were made.
RESULTS
As reported previously (16), the 1,581 SIGT study subjects had an average age of 48 years and BMI of 30.3 kg/m2; 42% were male, and 58% were black. The 2,014 NHANES III subjects had an average age of 55 years and BMI of 27.3 kg/m2; 47% were male, and 10% were black. The 1,111 NHANES 2005–2006 subjects had an average age of 46 years and BMI of 28.5 kg/m2; 49% were male, and 13% were black (supplementary Tables 1A–1C, available in an online appendix).
Using OGTT results, 5.8% of the combined study subjects had new diabetes, and 36% had pre-diabetes (Table 1). Moreover, the proportions were similar in the three study populations: 4.6 and 33% in the SIGT study (16), 7.6 and 38% in NHANES III, and 5.2 and 36% in NHANES 2005–2006 (supplementary Tables 1A–1C). In contrast, assessment by A1C was different from OGTT characterization: 2.3% of combined subjects were categorized as diabetes and 6.2% were high risk by IEC criteria, whereas 2.3% were categorized as diabetes and 19.5% were high risk by ADA criteria. The three populations were categorized in similar proportions by A1C with the IEC and ADA criteria.
Subjects identified by OGTT compared with A1C diagnoses
| OGTT categories | A1C categories | |||||
|---|---|---|---|---|---|---|
| IEC | ADA | |||||
| Normal A1C <6.0% | High risk A1C = 6.0–6.4% | Diabetes A1C ≥6.5%* | Normal A1C <5.7% | High risk A1C = 5.7–6.4% | Diabetes A1C ≥6.5%* | |
| Row-wise % | ||||||
| NGT, 58 ± 2.3% | 97 ± 0.90 | 2.5 ± 0.80 | 0.29 ± 0.12 | 88 ± 3.0 | 12 ± 2.9 | 0.29 ± 0.12 |
| Pre-diabetes, 36 ± 1.4% | 89 ± 2.7 | 10 ± 1.9 | 0.95 ± 0.05 | 70 ± 4.0 | 29 ± 4.0 | 0.95 ± 0.05 |
| Diabetes, 5.8 ± 0.9% | 49 ± 2.9 | 21 ± 1.2 | 30 ± 1.9 | 30 ± 2.6 | 40 ± 3.0 | 30 ± 1.9 |
| % of total | ||||||
| NGT | 57 ± 2.3 | 1.5 ± 0.46 | 0.18 ± 0.08 | 51 ± 2.8 | 7.0 ± 1.7 | 0.18 ± 0.08 |
| Pre-diabetes | 32 ± 1.7 | 3.5 ± 0.59 | 0.35 ± 0.03 | 25 ± 2.1 | 10 ± 1.2 | 0.35 ± 0.03 |
| Diabetes | 2.8 ± 0.53 | 1.2 ± 0.15 | 1.7 ± 0.28 | 1.8 ± 0.44 | 2.3 ± 0.25 | 1.7 ± 0.28 |
Every subject was mapped according to an OGTT and A1C diagnostic criteria into 3 × 3 tables, and the percentage of the subjects within each dataset was determined. NHANES values are from weighted estimates. Values were combined across the three datasets and the mean and SEM are shown. Each value in the upper rows is the mean and SEM of row-wise percentages, and percentage of subjects in each OGTT category is also included. The lower rows show the percentage of the entire population.
*Data in A1C categories for diabetes are the same for ADA and IEC diagnostic criteria.
Thus, compared with an OGTT, A1C testing resulted in more normal diagnoses (categorizations) and fewer high risk and diabetes diagnoses with both the IEC and ADA criteria. The ADA criteria resulted in a distribution of diagnoses more similar to those with the OGTT criteria by identifying more subjects as high risk and fewer subjects as normal. The different distribution for OGTT versus the A1C criteria was seen in males, females, and non-Hispanic whites but not in non-Hispanic blacks (supplemental Tables 1A–1C), in whom A1C diagnoses of diabetes and high risk using the ADA criteria were more frequent.
A1C-based categorizations were mostly incorrect for OGTT diagnoses of both pre-diabetes and diabetes. Use of both the ADA and the IEC criteria would result in more false-positive and false-negative categorizations than with the OGTT (Table 2), generally more false-negative than false-positive results. The IEC criteria generated more false-negative and fewer false-positive results than the ADA criteria. Incorrect identifications across the three datasets averaged 90 and 71% for pre-diabetes (by IEC and ADA criteria, respectively, combining false-positive and false-negative results), 84 and 65% for dysglycemia (all false-negative results), and 70% for diabetes (all false-negative results). Extrapolating the NHANES 2005–2006 findings to the non-Hispanic American adult population, A1C testing would incorrectly identify diabetes in 6.5 million (false-positive and false-negative results). A1C testing for pre-diabetes would also be incorrect for 43 million Americans using the ADA criteria and 52 million using the IEC criteria, with the majority of those being pre-diabetic by an OGTT but normal by A1C (Table 2). Importantly, the ADA criteria would also label non-Hispanic Americans with normal results on the OGTT (5.8 million as high risk and 75,000 as diabetes).
Rates of correct and incorrect classification
| OGTT criteria | IEC criteria | ADA criteria |
|---|---|---|
| Normal (%) | ||
| % correct | 97 ± 0.90 | 88 ± 3.0 |
| FP high risk | 2.5 ± 0.79 | 12 ± 2.9 |
| FP diabetes | 0.30 ± 0.12 | 0.30 ± 0.12 |
| Pre-diabetes (%) | ||
| % correct | 10 ± 1.9 | 29 ± 4.0 |
| FN normal | 89 ± 1.9 | 70 ± 4.1 |
| FP diabetes | 0.97 ± 0.04 | 0.97 ± 0.04 |
| Dysglycemia (%) | ||
| % correct | 16 ± 2.0 | 35 ± 3.5 |
| FN normal | 84 ± 2.0 | 65 ± 3.5 |
| Diabetes (%) | ||
| % correct | 30 ± 1.9 | 30 ± 1.9 |
| FN normal | 49 ± 2.9 | 30 ± 2.6 |
| FN high risk | 21 ± 1.2 | 40 ± 3.0 |
Correct or incorrect classification within each diagnostic category was evaluated in each dataset, and the average ± SEM of the rates across the three datasets is listed. % correct is the proportion of subjects with a given OGTT diagnostic criterion who were correctly identified by A1C diagnostic criteria. Incorrect diagnoses were false positive (FP) and false negative (FN), which were further categorized as being incorrectly normal, high risk, or diabetes per A1C testing. SIGT study proportions were calculated from raw data; NHANES proportions were calculated from weighted estimates.
ROC curve analyses were performed to determine whether screening categorization by A1C versus OGTT was independent of cutoff values. ROC curve areas were lowest for pre-diabetes and higher for diabetes (Fig. 1). Only for diabetes were areas under the ROC curve areas ≥0.80 (0.82 in the SIGT study, 0.80 in NHANES III, and 0.83 in NHANES 2005–2006), whereas for pre-diabetes they were lowest (0.65 in SIGT study, 0.62 in NHANES III, and 0.68 in NHANES 2005–2006), and intermediate for dysglycemia (0.67 in the SIGT study, 0.66 in NHANES III, and 0.70 in NHANES 2005–2006).
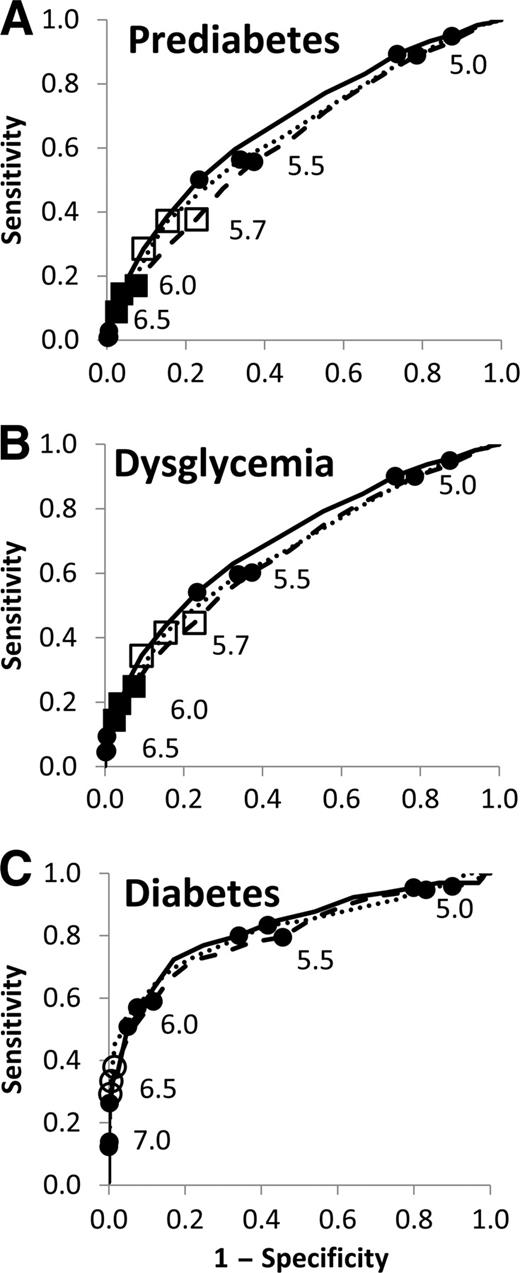
ROC curve analyses for each of the three datasets, showing A1C screening to detect pre-diabetes, dysglycemia, and diabetes. A: Pre-diabetes. B: Dysglycemia. C: Diabetes. ●, 0.5% intervals of A1C; ○, ADA and IEC cutoff for diabetes at A1C = 6.5%; □, ADA cutoff for high risk at A1C = 5.7%; ■, IEC cutoff for high risk at A1C = 6.0%. Points are labeled with A1C values. · · · · ·, SIGT study; – – –, NHANES III; ——, NHANES 2005–2006.
ROC curve analyses for each of the three datasets, showing A1C screening to detect pre-diabetes, dysglycemia, and diabetes. A: Pre-diabetes. B: Dysglycemia. C: Diabetes. ●, 0.5% intervals of A1C; ○, ADA and IEC cutoff for diabetes at A1C = 6.5%; □, ADA cutoff for high risk at A1C = 5.7%; ■, IEC cutoff for high risk at A1C = 6.0%. Points are labeled with A1C values. · · · · ·, SIGT study; – – –, NHANES III; ——, NHANES 2005–2006.
To assess alternative cutoffs, we evaluated sensitivity, specificity, positive predictive value, and negative predictive value for different A1C cutoffs across the three datasets (supplementary Table 2, available in an online appendix). Both the IEC and the ADA criteria are specific for diagnosing diabetes and pre-diabetes (>90% specificity above A1C cutoffs of 6.0%) but insensitive for both diabetes (<34% at A1C cutoff ≥6.5%) and pre-diabetes (lowest with IEC criteria: <31% above the cutoff of 5.7% and <13% above the A1C cutoff of 6.0%). Approximately equal sensitivity and specificity would be provided by cutoffs of 5.3–5.5% for pre-diabetes or dysglycemia and of 5.5–5.8% for diabetes. The sum of sensitivity and specificity was maximized at 5.4–5.6% for pre-diabetes, 5.5–5.6% for dysglycemia, and 5.7–5.9% for diabetes.
However, even cutoffs maximizing the sum of sensitivity and specificity for the NHANES 2005–2006 dataset (A1C 5.4% for high risk and 5.7% for diabetes) would incorrectly identify diabetes in ∼21 million (19 million false-positive results and 2.2 million false-negative results) and incorrectly identify high risk in 59 million non-Hispanic American adults, with fewer false-positive results but more false-positive results at these lower cutoffs.
Repeating the above analyses with a higher fasting plasma glucose cutoff for normal glucose tolerance (FPG <110 mg/dl) did not change the results (see supplementary Tables 2, 3, and 4, and supplementary Fig. 1, available in an online appendix).
In addition, the impact of the A1C-based criteria differs by race. There would be more false-negative results and fewer false-positive results (Fig. 2) in non-Hispanic whites than blacks with both the IEC and ADA criteria (P < 0.05 for both). Of those with diabetes by OGTT, 78% of whites vs. 51% of blacks would have false-negative results (P < 0.01), whereas 0.3% of whites vs. 1.8% of blacks without diabetes would have false-positive results (P = 0.15). With the IEC criteria for high risk, 94% of whites vs. 77% of blacks with pre-diabetes by OGTT would have false-negative results, whereas 1.7% of whites vs. 9.0% of blacks without pre-diabetes would have false-positive results (P < 0.02 that whites have more false-negative and less false-positive results). At the lower ADA cutoff for high risk, there would be fewer false-negative but more false-positive results: 78% of whites vs. 56% of blacks with pre-diabetes by OGTT would have false-negative results, whereas 8.5% of whites vs. 18% of blacks without pre-diabetes would have false-positive results (P < 0.05 that whites have more false-negative than false-positive results). However, the percentage of incorrectly identified high-risk subjects (false-negative plus false-positive results) with A1C screening for pre-diabetes was lower with the ADA criteria: 96% of whites and 86% of blacks with the IEC criteria vs. 87% of whites and 73% of blacks with the ADA criteria.

Rates of false-positive and false-negative A1C screening compared with OGTT screening according to race across the three study populations. □, non-Hispanic whites; ■, non-Hispanic blacks. The rates of subjects with false-positive (FP) and false-negative (FN) results for black and white subgroups across the populations are shown as mean ± SEM.
Rates of false-positive and false-negative A1C screening compared with OGTT screening according to race across the three study populations. □, non-Hispanic whites; ■, non-Hispanic blacks. The rates of subjects with false-positive (FP) and false-negative (FN) results for black and white subgroups across the populations are shown as mean ± SEM.
With extrapolation from the NHANES 2005–2006 dataset, A1C screening with the IEC and ADA criteria would incorrectly identify diabetes (false-positive or false-negative results) in 470,000 black and 6 million white non-Hispanic Americans. The IEC criteria would incorrectly identify high risk in 6 million black and 42 million white non-Hispanic Americans. Although there would be fewer missed subjects using the ADA criteria, potentially incorrect diagnoses would only be reduced for non-Hispanic black adults, incorrectly identifying high risk in 4 million black but 47 million white non-Hispanic Americans.
CONCLUSIONS
Our analyses demonstrate that the IEC and ADA A1C diagnostic criteria have limitations for use in screening, which include 1) high specificity but low sensitivity, 2) intrinsic inaccuracy even with alternative cutoffs, and 3) discrepant application to different racial groups. The results are consistent with two different methodologies for measurement of A1C (immunoassay in the SIGT study and high-performance liquid chromatography in NHANES) and with one dataset including black and white volunteers (the SIGT study) and two others representative of the non-Hispanic American population (NHANES III and NHANES 2005–2006). Although our findings support diagnosing diabetes by the proposed A1C criteria as rarely false positive, use of the proposed criteria would not be a good screening strategy to identify the many Americans who currently have unrecognized diabetes or pre-diabetes as found with OGTTs, a diagnostic standard currently used around the world.
Although the IEC and ADA did not recommend use of their criteria for screening, A1C testing has attractive features, including simplicity, standardization, availability, low day-to-day variability, and lack of need for prior fasting or restriction in time of measurement, and A1C is widely used as an indicator of diabetes control. In addition, the IEC stated that A1C “may be better” than glycemic criteria for diagnosing diabetes (4), and the ADA listed the A1C criteria “above” the glycemic criteria (5). However, other workers have questioned the use of A1C measurements for diagnosis (6,19). Several groups have now applied the proposed IEC criteria to a variety of datasets. The IEC criteria would miss diagnoses of diabetes and pre-diabetes in an older, predominantly white American population (8), and in another NHANES population with measurement of FPG but no OGTTs (7), and ROC curve areas, sensitivity and specificity were similar to those in the current study with an American population enriched in Hispanic adults (12). There was greater variability in the international studies (9,–11,13), possibly reflecting ethnic and racial differences as well as differences in the underlying rates of undiagnosed diabetes (9,11). None of the studies found the IEC high-risk criteria to be similar to pre-diabetes with OGTTs (10,11,13).
It is beyond our analysis to address the accuracy of OGTT versus A1C, but they differ intrinsically. A1C within an individual fluctuates little from day to day, whereas an OGTT can reflect day-to-day differences in insulin secretion and insulin action. As such, A1C should better assess glycemic trends over several months, whereas an OGTT should better assess immediate glucose homeostasis. Moreover, there is substantial interindividual variation in A1C at the same levels of glycemia (20,21), reflecting differences in red cell penetration, glycation, hemoglobin species, red cell half-life, vitamin and medication status, and others factors (22). Such variation would be expected to make it more difficult for A1C measurements to distinguish small differences in glycemia, e.g., pre-diabetes versus normal.
Our findings that the proposed A1C criteria result in more false-positive and fewer false-negative results in blacks compared with whites are consistent with previous reports that at similar glucose levels, A1C levels are higher in blacks than whites (23). This finding explains both relative underdiagnosis in whites and overdiagnosis in blacks. The basis for such differences remains unknown.
The strengths of our study include assessments in >4,500 subjects, similarity of findings across multiple datasets with different A1C methodologies, evaluation of both IEC and ADA criteria, comparison of the general utility of A1C screening with the specific problems of the proposed criteria, and the identification of potential problems in applications to different racial/ethnic groups. One limitation is performance of only a single OGTT, but such an approach reflects clinical practice. Moreover, abnormal results on a single OGTT was highly predictive of subsequent diabetes in Pima Indians (24), and differences found on repeat studies should be included in the variability of the ROC curve analyses. We also did not search for factors that can be problematic for A1C measurements, such as hemoglobinopathies and anemia. Further studies would be required before our findings with the ADA criteria could be generalized to other racial/ethnic groups, but problems with the IEC criteria have been reported with diverse populations (8,9,12).
Although A1C screening may be of limited value, better test characteristics appear to be provided by measuring random plasma glucose (25) or glucose 1 h after a 50-g oral glucose challenge (16); either could be obtained opportunistically during office visits, at any time of day, and without a prior fast. Other tests or combinations of tests may also be useful, and it is possible that health economics analyses would identify one or another test as being more cost-effective in different patient populations and clinical settings. We still need to identify previously unrecognized diabetes and pre-diabetes to initiate preventive management.
The costs of publication of this article were defrayed in part by the payment of page charges. This article must therefore be hereby marked “advertisement” in accordance with 18 U.S.C. Section 1734 solely to indicate this fact.
Acknowledgments
This work was supported in part by National Institutes of Health (awards DK-066204, 5K23-DK-070715, and T32-DK-007298) and Veterans Administration (VA Health Services Research and Development award IIR 07-138).
The funding sources played no roles in the design and conduct of the study; collection, management, analysis, and interpretation of the data; and preparation review, or approval of the manuscript.
No potential conflicts of interest relevant to this article were reported.
D.E.O. devised the research questions, formulated the research plan, researched data, and wrote the manuscript. M.K.R. devised the research questions, formulated the research plan, researched data, and reviewed/edited the manuscript. K.H. researched data and reviewed/edited the manuscript. D.C.Z. devised the research questions, formulated the research plan, and researched data. J.G.T. devised the research questions, formulated the research plan, and reviewed/edited the manuscript. L.S.P. devised the research questions, formulated the research plan, oversaw all research of data, wrote the manuscript, and reviewed/edited the manuscript.
Parts of this study were presented in abstract form at the 70th annual meeting of the American Diabetes Association, Orlando, Florida, 25–29 June 2010.
