


OBJECTIVE—To investigate urinary albumin excretion (UAE) and its relation with C-reactive protein (CRP) and the metabolic syndrome in the prediction of the development of type 2 diabetes.
RESEARCH DESIGN AND METHODS—We used data from the Prevention of Renal and Vascular End Stage Disease (PREVEND) study, an ongoing, community-based, prospective cohort study initiated in 1997 in the Netherlands. The initial cohort consisted of 8,592 subjects. After 4 years, 6,894 subjects participated in a follow-up survey. Subjects with diabetes at baseline or missing data on fasting glucose were excluded, leaving 5,654 subjects for analysis. The development of type 2 diabetes, defined as a fasting glucose ≥7.0 mmol/l and/or the use of antidiabetic medication, was used as the outcome measure. UAE was calculated as the mean UAE from two consecutive 24-h urine collections. Logistic regression models were used, with the development of type 2 diabetes as the dependent variable.
RESULTS—Of the 5,654 subjects for whom data were analyzed, 185 (3.3%) developed type 2 diabetes during a mean follow-up period of 4.2 years. UAE, CRP, and the presence of the metabolic syndrome at baseline were significantly associated with the incidence of type 2 diabetes (P < 0.001 for all variables). In a univariate model, the odds ratio (OR) for UAE was 1.59 (95% CI 1.42–1.79). In our full model, adjusted for age, sex, number of criteria of metabolic syndrome, and other known risk factors for the development of type 2 diabetes (including fasting insulin), the association between UAE and type 2 diabetes remained significant (OR 1.53, 95% CI 1.25–1.88, P < 0.001). There was a significant interaction between UAE and CRP (P = 0.002). After CRP was stratified into tertiles, the ORs for the association between baseline UAE and the development of type 2 diabetes were 2.2 (1.47–3.3), 1.33 (0.96–1.84), and 1.04 (0.83–1.31) for the lowest to highest tertiles, respectively.
CONCLUSIONS—UAE predicts type 2 diabetes independent of the metabolic syndrome and other known risk markers of development of type 2 diabetes. The predictive value of UAE was modified by the level of CRP.
Although increased urinary albumin excretion (UAE) often occurs after type 2 diabetes is established, it can already be present at the time of diagnosis of type 2 diabetes. This might be due to the fact that type 2 diabetes can be present many years before the formal, clinical diagnosis (1). Indeed, Damsgaard and Mogensen (2) showed that the prevalence of microalbuminuria is already increased before fasting hyperglycemia becomes clinically evident as diabetes. However, it could also imply that elevations in UAE precede the development of type 2 diabetes. Two lines of evidence support this latter possibility. First, UAE is associated with the presence of the metabolic syndrome in the nondiabetic population (3). The metabolic syndrome, a clustering of several cardiovascular risk factors, is known to increase the risk for the development of type 2 diabetes (4). Second, UAE is thought to reflect generalized vascular endothelial dysfunction (5,6). Recently, high-sensitivity C-reactive protein (CRP), which reflects a low-grade chronic inflammatory state that is closely linked to generalized vascular endothelial dysfunction (7–9), has been shown to predict the development of type 2 diabetes (10–12).
Based on these previous findings, we hypothesized that the presence of increased UAE in the nondiabetic population is associated with an increased risk of development of type 2 diabetes. The aim of the present study was to test this hypothesis. We also compared the predictive value of UAE, CRP, and the metabolic syndrome for the development of type 2 diabetes.
RESEARCH DESIGN AND METHODS
This study was part of the Prevention of Renal and Vascular End Stage Disease (PREVEND) study, an ongoing, prospective cohort study designed to investigate the predictive value of UAE for renal and cardiovascular disease progression. The 8,592 subjects of the PREVEND cohort were selected in 1997 from 40,856 subjects from the general population based on their albumin concentration in a morning urine sample (13). These subjects completed the first survey in 1997–1998. After ∼4 years (2001–2003), these subjects were invited for a second survey. By then, 240 subjects had died and 1,458 subjects declined participation; thus 6,894 subjects completed the second screening.
Our study used data from the first and second screening. Subjects with diabetes at baseline (n = 318) or missing data on fasting plasma glucose at the first or second screening (n = 922) were excluded, leaving 5,654 subjects for analysis. The PREVEND study was approved by the medical ethics committee of our institution and conducted in accordance with the guidelines of the Declaration of Helsinki. All participants gave written informed consent.
The study protocol has been described in detail elsewhere (13,14). All participants completed a questionnaire on demographics, cardiovascular and renal history, and the use of medication for diabetes, hypertension, and hyperlipidemia. For each screening subjects were seen twice at an outpatient unit. During the first visit, anthropometric measurements (height, weight, and waist circumference) were taken. Before the second visit, subjects collected two consecutive 24-h urine samples over a 48-h period after receiving oral and written instructions on the urine collection procedure. At the second visit, a fasting blood sample was drawn. During the first and second visits, blood pressure was measured in the supine position every minute for 10 and 8 min, respectively, with an automatic device (Dinamap XL Model 9300; Johnson & Johnson Medical, Tampa, FL).
The urinary albumin concentration was determined by nephelometry, with a threshold of 2.3 mg/l and intra- and inter-assay coefficients of variation (CVs) of 2.2 and 2.6%, respectively (BNII; Dade Behring Diagnostic, Marburg, Germany). UAE is given as the mean of the two 24-h urine excretions. High-sensitivity CRP was also determined by nephelometry, with a threshold of 0.175 mg/l and intra- and interassay CVs of 4.4 and 5.7%, respectively (BNII; Dade Behring Diagnostics). UAE and CRP levels below the detection level were scored as 2.3 and 0.18 mg/l, respectively. Serum concentrations of total cholesterol, HDL cholesterol, and triglycerides were measured by standard methods. Insulin was determined on an AxSym (Abbott, Amstelveen, the Netherlands), with a threshold of 1.0 μU/ml and intra- and interassay CVs of 2.6 and 4.3%, respectively. Glucose was determined in plasma and whole blood at the first and second screening, respectively, using standard methods. Glucose values in whole blood were transformed to plasma values using an internally validated correction factor (15).
Blood pressure values are given as the mean of the last two recordings of both visits. BMI was calculated as weight (in kilograms) divided by the square of height (in meters). Diabetes was defined on a single fasting plasma glucose level of ≥7.0 mmol/l, according to 1997 American Diabetes Association criteria (16), or the use of oral antidiabetic drugs, as reported by the participants. An impaired fasting glucose was defined on a single fasting plasma glucose level ≥6.1 mmol/l. The metabolic syndrome was defined according to the National Cholesterol Education Program Expert Panel on Detection, Evaluation, and Treatment of High Blood Cholesterol in Adults 2001 criteria (17). At least three of the following five criteria were needed for the syndrome to be present: waist circumference >102 cm in men and >88 cm in women, serum triglycerides ≥1.7 mmol/l, HDL cholesterol <1.0 mmol/l in men and <1.3 mmol/l in women, hypertension (≥130/85 mmHg), and impaired fasting glucose (≥6.1 mmol/l).
Analyses were performed using the statistical package SPSS 12.0 (SPSS, Chicago, IL). The significance level was determined as P < 0.05. Continuous data are reported as means ± SD. In the case of a skewed distribution, the median and interquartile range are presented. Prevalences and incidences are presented as percentages. Differences between groups were tested for continuous data by Student’s t test or a Mann-Whitney rank test in the case of skewed distribution. Differences in prevalence or incidence were tested with a χ2 test.
Logistic regression analyses were performed, with the development of type 2 diabetes as the dependent variable. Because of a skewed distribution, logarithmic transformation (ln) of UAE, CRP, insulin, and triglycerides was applied in logistic regression analysis to fulfill the necessity of linearity in the logit. Subjects with missing data were excluded from multivariate analysis (n = 408). In secondary analyses, multivariate logistic regression analyses were repeated after imputing missing values using expectation maximization as estimation method. Models were tested for the interaction of independent variable terms. Interactions were considered significant at P < 0.1. Models were tested for tolerance to collinearity with the methods described by Hosmer and Lemeshow (18). Data of logistic regression analysis are given as ORs with a 95% CI. STATA/SE 8.0 for Windows (Stata, College Station, TX) was used to compare the area under the curve (AUC) of receiver operator curves.
RESULTS
We observed 24,009 person-years during a 4.2-year follow-up period. Of the 5,654 subjects analyzed, 185 (3.3%) developed type 2 diabetes, giving an incidence rate of 7.7 per 1,000 person-years. In subjects age 50–75 years at the time of the first screening, the incidence of type 2 diabetes was 5.2%. Table 1 compares the baseline characteristics of the subjects who did and did not develop type 2 diabetes. Subjects who did develop diabetes were older, more frequently had a positive family history of diabetes, and more often used antihypertensive and lipid-lowering drugs. All variables that are components of the metabolic syndrome were elevated in this group, except HDL cholesterol, which was lower; this finding was reflected in a higher proportion of these individuals fulfilling the criteria for the metabolic syndrome than those who did not develop type 2 diabetes. Furthermore, subjects who progressed to type 2 diabetes had a significantly higher baseline UAE and CRP concentration than those who did not. There was no difference in the length of follow-up, sex distribution, or the use of lipid-lowering drugs between the two groups.
We compared baseline characteristics of subjects included in this study (n = 5,654) with baseline characteristics of subjects not included in this study (n = 2,938), with the exception of subjects with diabetes at baseline (n = 318). Numerical differences in baseline characteristics of subjects included in the study were <3% compared with those not included in the study, with the exception of UAE (median 9.1 vs. 9.7), CRP (median 1.2 vs. 1.4), and insulin (median 7.7 vs. 8.5) and triglyceride (median 1.1 vs. 1.2) concentrations. With the exception of cholesterol, family history of diabetes or hypertension, and use of antihypertensive or lipid-lowering drugs, all these numerically small differences reached statistical significance due to the large number of subjects under investigation.
Figure 1 shows the incidence of type 2 diabetes in various subgroups of the total population, subdivided according to clinical categories of UAE, CRP, and the number of positive criteria for the metabolic syndrome at baseline. Higher baseline levels of UAE and CRP and an increase in the number of components of the metabolic syndrome were associated with a significant increase in the incidence of type 2 diabetes. The increase associated with baseline UAE started at a UAE <30 mg/24 h, the level currently defining microalbuminuria. When the population was subdivided according to tertiles of UAE at baseline (≤6.9, 6.9–12.4, and ≥12.4 mg/24 h), the incidence of type 2 diabetes was 1.8, 2.3, and 5.7%, respectively (P < 0.001).
When logarithmic-transformed UAE [ln(UAE)] was entered into a logistic regression model with type 2 diabetes as the dependent variable, the ln(UAE) was a significant predictor of the development of type 2 diabetes (OR 1.59 per each logarithmic-transformed unit increase, 95% CI 1.42–1.79, P < 0.001) (Table 2, model 1). Adjustment for age and sex only slightly attenuated the effect (Table 2, model 2). When we subsequently adjusted the model for baseline levels of the components of the metabolic syndrome and CRP, we found that UAE was still significantly associated with the development of type 2 diabetes (OR 1.47, 95% CI 1.20–1.80, P < 0.001). Furthermore, a significant interaction was found between UAE and CRP (0.81, 0.70–0.94, P = 0.006) (Table 2, model 3). The addition of baseline insulin levels, the presence of a family history of diabetes and/or cardiovascular disease, and the use of antihypertensive or lipid-lowering drugs to the model did not influence the results obtained (Table 2, model 4). Other variables in this model that were significantly associated with the development of type 2 diabetes were sex (P < 0.001), age (P = 0.010), waist circumference (P < 0.014), HDL cholesterol (P < 0.005), glucose (P < 0.001), and the presence of a family history of diabetes (P = 0.048).
To test the robustness of our model, we repeated our analyses after excluding subjects with an impaired fasting glucose or the metabolic syndrome at baseline and after replacing the covariate waist circumference with BMI. Furthermore, we repeated multivariate logistic regression analyses after imputing missing data. None of these sensitivity analyses essentially changed the results.
Next, we repeated our model 4 in strata according to tertiles of CRP. Results for ln(UAE) in the three strata of CRP were OR 2.2 (95% CI 1.47–3.3), 1.33 (0.96–1.84), and 1.04 (0.83–1.31) from the lowest to the highest tertile, respectively. We visualized the interaction between UAE and CRP in Fig. 2 using clinical categories. This graph shows that UAE predicts the development of type 2 diabetes most strongly when the level of CRP is low and vice versa. As the concentration of CRP or the level of UAE increases, the risk added by a high UAE or CRP, respectively, diminishes.
Finally, we compared the predictive value of baseline UAE, CRP, and the number of positive criteria of the metabolic syndrome for the development of type 2 diabetes using receiver operator curves. AUC for UAE, CRP, and the metabolic syndrome criteria was 0.66, 0.68, and 0.77, respectively. The sensitivity and specificity were 30 and 88%, respectively, for UAE ≥30 mg/24 h; 40 and 80%, respectively, for a CRP ≥3 mg/l; and 52 and 85%, respectively, for the presence of three or more components of the metabolic syndrome. There was no significant difference in the AUC between UAE and CRP (P = 0.44), whereas the AUC for the metabolic syndrome was significantly greater than the AUC of UAE and CRP (P < 0.001).
CONCLUSIONS
This study showed that UAE is associated with the development of type 2 diabetes independent of other predisposing factors. This association is modified by the level of CRP and starts with UAE in the range of 15–30 mg/24 h, which has been considered to reflect borderline albuminuria or a premicroalbuminuria stage (19). Our study confirmed that CRP and the metabolic syndrome were associated with an increased risk of development of type 2 diabetes (4,10–12).
Elevated UAE has always been considered a consequence of diabetes (1); here we found that UAE may also predict the development of type 2 diabetes. Although all subjects with diabetes at baseline were excluded in our study, one might argue that our results were caused by misclassification. Some of the subjects with a high UAE may have had an undetected presence of type 2 diabetes at baseline. Baseline glucose may have been measured erroneously below the cutoff value due to intra-individual variations in glucose levels and variations in the glucose measurement itself. To deal with this possible source of bias, we adjusted for baseline values of glucose and insulin, as a high insulin level may indicate the undetected presence of type 2 diabetes at baseline. Furthermore, we repeated our models after excluding all subjects with impaired fasting glucose or the metabolic syndrome at baseline. None of these sensitivity analyses affected our results. We are therefore convinced that our conclusion that UAE can predict the development of type 2 diabetes is valid.
A previous study by Mykkanen et al. (20) also found an association between UAE and the development of type 2 diabetes. The population in this study was older and had a higher baseline prevalence of hypertension and a higher incidence rate of diabetes than the population in our study. The association found by Mykkanen et al. was no longer significant after they adjusted for baseline values of glucose and insulin. It could be that in this older population, pancreatic β-cell failure may have been a more important factor than insulin resistance. Indeed, the assay used by Mykkanen et al. had a 41% cross-reactivity for proinsulin versus the 0.016% for our assay (21). Because levels of proinsulin are associated with β-cell function (22), Mykkanen et al. (20) may have adjusted for both β-cell insufficiency and insulin resistance. Furthermore, their study was performed in a substantially smaller cohort, with substantially fewer new cases of type 2 diabetes. It may therefore have been underpowered to detect an association between UAE and new-onset type 2 diabetes independent of glucose and insulin.
How can we explain these results? First, elevated UAE is associated with the presence of the metabolic syndrome (3). In this and other studies, the presence of the metabolic syndrome increased the risk of type 2 diabetes (4). However the association we found between baseline levels of UAE and CRP and the development of type 2 diabetes was independent of the presence of the components of the metabolic syndrome at baseline. Also, excluding subjects with metabolic syndrome at baseline did not change our results. Thus it is unlikely that our results can be explained through the association of UAE with the metabolic syndrome. Second, elevated UAE is associated with insulin resistance (23,24). Insulin resistance has a primary role in the etiology of type 2 diabetes (25) and is accompanied by hyperinsulinemia in subjects without impaired insulin secretion (26). Insulin can cause renal vasodilatation, resulting in an increased glomerular filtration rate and glomerular hydrostatic pressure gradient (27,28), which may cause an increased UAE. However, when we added insulin to our logistic regression model, the results were not essentially changed, rendering this explanation less likely. A third possibility is the association of increased UAE with the presence of systemic vascular endothelial dysfunction. Endothelial dysfunction has been shown to precede the development of type 2 diabetes (29) and is hypothesized to be the cause of insulin resistance (30). However, type 2 diabetes not only is a consequence of endothelial dysfunction, but also is thought to contribute to the development and progression of endothelial dysfunction (31). Thus, the association between UAE and endothelial dysfunction may not explain only why UAE is associated with an increased risk of type 2 diabetes, but also why UAE may develop and progress after the onset of diabetes. This explanation is even more likely as we and others have found an association between CRP and the risk of type 2 diabetes (10–12). As mentioned above, the CRP concentration is a marker of low-grade inflammation and is closely linked with the presence of endothelial dysfunction. Because both UAE and CRP are considered to reflect endothelial dysfunction, this would also explain why in our study, when UAE or CRP was elevated, there was only a small gain in knowing the value of the other parameter in assessing the risk of type 2 diabetes. Finally, other possibilities should be kept in mind. In particular, shared underlying predisposing factors such as genetic or congenital factors may explain the association between UAE, CRP, and the development of type 2 diabetes (32).
The second aim of our study was to compare the predictive power of baseline UAE and CRP levels and the number of positive criteria of the metabolic syndrome with the development of type 2 diabetes. The metabolic syndrome is considered to be a good candidate for detecting subjects at a high risk of developing type 2 diabetes (33). The performance of UAE and CRP was similar, but both were slightly inferior to that of the metabolic syndrome.
Our study had several limitations. First, the PREVEND study is not primarily designed to investigate the relation between UAE and type 2 diabetes. Also, the cohort was selected from a mainly Caucasian population. Our findings therefore need to be confirmed in other studies and populations. Second, we used two different methods to determine values of fasting glucose at the first and second screenings. According to international guidelines, we used an internally validated correction factor to convert the values for fasting glucose in whole blood to the equivalent values in plasma (15). Still, a systematic error may have occurred, leading to an over- or underestimation of the incidence of type 2 diabetes. However, the incidence of type 2 diabetes in subjects age 50–75 years in our study was comparable with the incidence in this age group in the Dutch population (34). Furthermore, to control for a possible systematic error, we repeated our analyses by changing the cutoff values of fasting glucose for the diagnosis of type 2 diabetes at follow up to 6.5 and 7.5 mmol/l, respectively. Although the results were slightly attenuated, this did not change our results. It is therefore unlikely that the different laboratory methods affected our results. Third, ∼30% of the participants of our baseline cohort were excluded from analyses due to loss at follow up or missing fasting glucose values. However, only numerically small differences in baseline characteristics were found between those included in the study and those who were excluded. It is therefore unlikely that this may have introduced bias. Fourth, fasting glucose was measured only once at each screening and no oral glucose tolerance test was performed. However, in large epidemiological studies, it is not feasible to perform oral glucose tolerance tests and/or repeated glucose measurements. Guidelines for epidemiological studies in diabetes acknowledge this and agree with defining diabetes on a single fasting glucose (35).
We conclude from this prospective cohort study that increased UAE not merely follows after the diagnosis of type 2 diabetes but also is a predictor of the development of type 2 diabetes. The predictive power is independent of other well-known risk factors for the development of type 2 diabetes, such as the metabolic syndrome. The effect of UAE was modified by the level of CRP, suggesting that these variables are associated with a similar underlying pathophysiological mechanism, such as endothelial dysfunction.
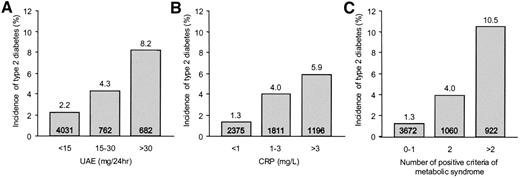
Incidence of type 2 diabetes after 4.2 years of follow-up by UAE and CRP concentrations and the number of positive criteria of the metabolic syndrome. A: Incidence by categories of UAE at baseline (P <0.001 for trend). B: Incidence by categories of CRP at baseline (P <0.001 for trend). C: Incidence by the number of positive components of the metabolic syndrome at baseline (P <0.001 for trend). Numbers in the bars indicate the number of individuals within the category.
Incidence of type 2 diabetes after 4.2 years of follow-up by UAE and CRP concentrations and the number of positive criteria of the metabolic syndrome. A: Incidence by categories of UAE at baseline (P <0.001 for trend). B: Incidence by categories of CRP at baseline (P <0.001 for trend). C: Incidence by the number of positive components of the metabolic syndrome at baseline (P <0.001 for trend). Numbers in the bars indicate the number of individuals within the category.

Incidence of type 2 diabetes after 4.2 years of follow-up by categories of UAE and CRP at baseline.
Incidence of type 2 diabetes after 4.2 years of follow-up by categories of UAE and CRP at baseline.
Characteristics of study subjects with and without newly diagnosed type 2 diabetes
| With | Without | P | |
|---|---|---|---|
| n | 185 | 5,469 | — |
| Age (years) | 56.5 ± 10.5 | 48.6 ± 12.0 | <0.001 |
| Follow-up (years) | 4.2 ± 0.4 | 4.2 ± 0.4 | 0.72 |
| Caucasian | 5,259 (96.2) | 178 (96.2) | 0.56 |
| Male | 100 (54.1) | 2,659 (48.6) | 0.15 |
| Family history of diabetes | 58 (31.4) | 948 (17.3) | <0.001 |
| Family history of cardiovascular disease | 81 (43.8) | 2,151 (39.3) | 0.22 |
| Waist (cm) | 99 ± 12 | 88 ± 12 | <0.001 |
| BMI (kg/m2) | 29.6 ± 4.7 | 25.8 ± 4.0 | <0.001 |
| Systolic blood pressure (mmHg) | 139 ± 21 | 127 ± 19 | <0.001 |
| Diastolic blood pressure (mmHg) | 78 ± 10 | 73 ± 10 | <0.001 |
| Use of antihypertensive drugs | 47 (25.4) | 560 (10.2) | <0.001 |
| Cholesterol (mmol/l) | 6.0 ± 1.1 | 5.6 ± 1.1 | <0.001 |
| HDL cholesterol (mmol/l) | 1.1 ± 0.3 | 1.3 ± 0.4 | <0.001 |
| Triglycerides (mmol/l) | 1.6 (1.2–2.5) | 1.1 (0.8–1.6) | <0.001 |
| Use of lipid-lowering drugs | 23 (12.4) | 294 (5.4) | <0.001 |
| Fasting glucose (mmol/l) | 5.7 ± 0.7 | 4.7 ± 0.6 | <0.001 |
| Impaired fasting glucose | 65 (35.1) | 118 (2.2) | <0.001 |
| Fasting insulin (mU/l) | 12.5 (9.1–19.0) | 7.6 (5.4–10.9) | <0.001 |
| Metabolic syndrome | 97 (52.4) | 825 (15.1) | <0.001 |
| CRP (mg/l) | 2.3 (1.3–4.7) | 1.2 (0.5–2.7) | <0.001 |
| UAE (mg/24h) | 14.6 (8.7–36.0) | 8.9 (6.2–15.2) | <0.001 |
Data are n (%), means ± SD, or median (interquartile range) in the case of skewed data distribution. Statistical analyses were performed with Student’s t test, the Mann-Whitney test in the case of a skewed distribution, or the χ2 test in the case of a categorical variable.
Logistic regression models, with development of type 2 diabetes as the dependent variable
| OR (95% CI) | P | |
|---|---|---|
| Model 1: ln(UAE) | 1.59 (1.42–1.79) | <0.001 |
| Model 2: ln(UAE) | 1.45 (1.28–1.64) | <0.001 |
| Model 3 | ||
| ln(UAE) | 1.47 (1.20–1.80) | <0.001 |
| ln(UAE) × ln(CRP) | 0.81 (0.70–0.94) | 0.006 |
| Model 4 | ||
| ln(UAE) | 1.53 (1.25–1.88) | <0.001 |
| ln(UAE) × ln(CRP) | 0.79 (0.68–0.92) | 0.002 |
Model 1: crude OR. Model 2: crude OR adjusted for age and sex. Model 3: model 2 adjusted for diastolic and systolic blood pressure, waist circumference, HDL cholesterol, triglycerides, glucose, and CRP. The interaction term between UAE and CRP is also given. Model 4: model 3 adjusted for insulin, family history of diabetes and/or cardiovascular disease, and use of antihypertensive and/or lipid-lowering medication.
References
A table elsewhere in this issue shows conventional and Système International (SI) units and conversion factors for many substances.